How to trade flat

How to trade flat

Surely you know that 80% of the time in the market is flat. At this time, quotes are in a narrow price corridor and move from one border to another. Traders are still debating whether flat trading is worth it. Let’s figure out whether the game is worth the candle, and are there any risks?

What is a flat on Forex?

A flat is a special state of the market when the price remains within a range for a long time, where the boundaries are well defined. During a flat, the price often comes close to the boundaries, but cannot go beyond the boundaries. Market activity at this time is minimal. Very often during the night session there is a flat. When the border of such a sideways movement is broken, this indicates that the flat is complete and a new trend movement is beginning to develop.

How can you make money during a flat?

One of the main disadvantages of flat trading is that it is difficult to predict the duration of small market activity. Market experts have different opinions as to whether it is necessary to trade during a flat. Many people believe that at this time it is better not to enter the market and not try to trade. However, there are also supporters of trading in small volumes.

For those traders who practice frequent short-term transactions with small profits, or in other words engage in scalping, flat trading is well suited. In addition, flat is perfect for trading from important levels. Flat is also an ideal environment for trading robots based on the Martingale strategy.

You can make money on the flat before news releases. By calculating the market movement after the news, you can catch the impulse from its very beginning.

But, despite the fact that everything looks simple, flat trading requires you to adhere to certain rules.

Basic rules for flat trading

There is no need to use lower time frames unless you are scalping. Trade starting from the 4H chart, if you want more signals, then do not go below 1h;
There is no need to take levels that are formed before the start of a session or after it closes as true support (resistance) levels. Often, they are short-lived;
It is extremely important to follow the rules of money management and not overestimate risks;

Use indicators to filter out market noise.

The last point is quite important, since the market often leaves the consolidation zone quite quickly, on large volumes. Using technical analysis makes it possible to accurately plot your goals on a chart.

Flat is an integral part of most technical analysis patterns. For example, a flat can be found in reversal patterns, such as head and shoulders or double tops. Sideways trades when the price fails to break the recent high and the low indicates the end of the trend.
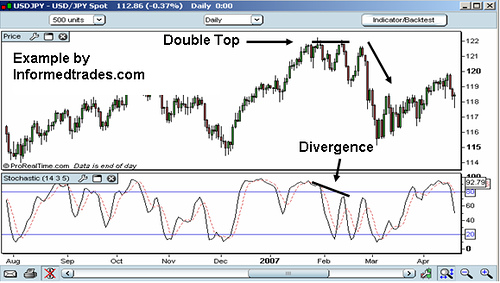
Stochastic oscillator

Any oscillator is suitable for flat trading. This indicator greatly simplifies the work during a sideways trend. Typically traders use either Stochastic or RSI. When the indicator shows overbought and the price is at the upper limit of the sideways range, then we sell. And vice versa. When oversold, we buy from the lower border. We recommend setting Stop-loss and Take-profit a little further than the boundaries. “Saw” is a common phenomenon in the market. This is when volatility increases, but the pair itself remains within the range. Asset quotes move up and down, often breaking through the boundaries and even leaving them for a short time.

Flat is a rather dangerous place. However, a certain part of traders prefer to trade during such periods. The ability to recognize the structure of the correction and the correct approach will allow you not to miss trading when there is no clear trend.
How understanding the correlation between assets will help you succeed in trading

Trading in financial markets requires not only instinct, but also deep knowledge.

Thus, correlation helps determine whether asset prices are moving in the same direction (positive correlation) or in opposite directions (negative correlation). Understanding asset correlation is key to developing flexible and resilient trading strategies that can adapt to ever-changing market conditions. Read More

RU: Фигуры Голова и Плечи

Наверное, многие слышали про фигуры трейдинга

Как входить на паттерн голова и плечи?

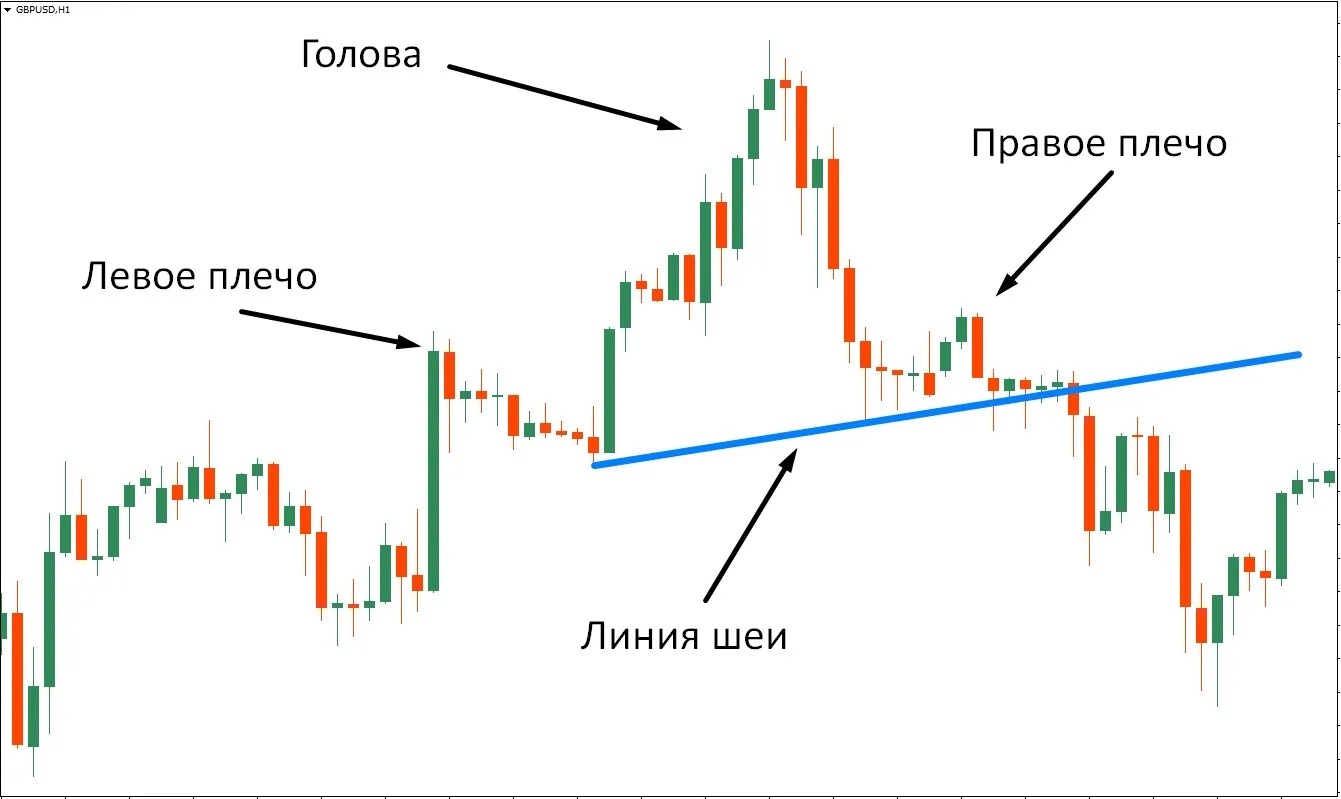
Выделить паттерн на графике можно по соответствию описания. Если мы видим левое плечо, голову и правое плечо, то после этого можно переходить к важному построению, которое позволит найти точку входа. Для этого нам нужно провести особую линию, которая называется линией шеи. Делается это после того, как у нас сформировалась сама голова, а правое плечо еще образуется. Соединяем точку начала головы и точку ее окончания, воспользовавшись инструментом линия в торговой платформе. В большинстве случаев она имеет наклон, желательно, чтобы линия была направлена вверх. Следующий этап заключается в том, чтобы открыть сделку по одному из предлагаемых сценариев:

  • Отложенный ордер на пробой образованной линии шеи. Располагаем прямо под ней.
  • Ждем, когда цена отскочит от линии и ставим отложенный ордер на пробой этого локального минимума.
  • Дожидаемся ретеста линии шеи.

. Это один из самых простых и одновременно эффективных методов анализа, в основе которого лежат наблюдения за рыночным поведением и формированием шаблонов. Каждый из шаблонов формируется последовательностью движений, которые образуют описанную форму или же имеют заданные соотношения между составляющими их элементами. Если увиденное на графике соответствует описанию, можно открывать сделку. Простейшим примером такой фигуры является Голова и плечи. Точка входа, однако же, иногда вызывает сложности у новичков. Найти ее могут не все, и из-за этого пропускается множество возможностей заработать на развороте тренда. Опишем построение и расскажем, как открывать сделки по паттерну.

Фигуры Голова и Плечи

Третий вариант достаточно консервативен, он предполагает вход по уже начавшей отрабатывать фигуре. Отметим, что ретест может не состояться. Если трейдер торгует только таким образом, то часть образующихся фигуры графического анализа форекс

Разбор всех методов входа в паттерн Голова и Плечи

Трудно найти более простую фигуру, чем Голова и плечи. Два зигзага, которые направлены в разные стороны и идут друг за другом несложно идентифицировать на графике. Но у этого паттерна есть некоторые особенности, которые рекомендуется учитывать при торговле. Выделим главное:

  • Если Голова и плечи образуются около технических уровней, то это в значительной степени повышает вероятность отработки. Подойдут фибоуровни, Ганн, Мюррей и обычные сопротивления (для перевёрнутого паттерна это будут поддержки);
  • Чем старше период графика, тем точнее работает модель. Обычно ГиП рассматривают от Н1 и выше, оптимально торговать на четырёхчасовом периоде;
  • Рекомендуется торговать только те инструменты, которые представляют большой интерес для рынка и обладают высоким показателем ликвидности. Среди валютных пар это основные и некоторые кроссы, на фондовом секторе индексы и голубые фишки.

Где ставить стоп-лоссы при торговле по паттерну Голова и Плечи?

На форексе эффективность обычной ГиП и перевернутой примерно одинаковая, но на фондовых инструментах рекомендуется работать с перевернутой. Объясняется это достаточно просто – падения акций обычно происходят очень динамично, разворот также формируется быстро. В то же время движение вверх может быть медленным, часто образуются сигналы разворота, которые не отрабатывают. Обучение фундаментальному анализу акций рассматривает этот момент и объясняет паникой на рынке. В остальном ГиП универсальна и предполагает высокую точность при работе в рамках описанных выше рекомендаций.

он будет пропускать. В качестве промежуточного варианта можно предложить разделение своего рабочего лота на 3 равные части. Каждая из них открывается по одному из трех описанных вариантов. Это снижает риск пропустить вход и повышает вероятность успеха, а также уменьшает потенциальный стоп-лосс в итоговом выражении. Ограничение убытков, как правило, устанавливают за правое плечо. Расстояние, на которое цена двигается после пробоя линии шеи обычно составляет как минимум диапазон самой фигуры. Иногда движение развивается динамично и есть возможность взять больше пунктов. Можно фиксировать прибыль частями. Например, через каждые 50-100 пунктов. Интервал устанавливается исходя из того, на каком таймфрейме образовалась фигура и какой ее общий диапазон.


Как правильно торговать во флете

Наверняка вы знаете, что 80% времени на рынке – флет. В это время котировки находятся в узком ценовом коридоре и двигаются от одной его границы к другой. Трейдеры до сих пор спорят, стоит ли заниматься торговлей во флете. Давайте разберемся, стоит ли игра свеч, и есть ли риски?

Что представляет собой флет на Форекс?

Флет – это особое состояние рынка, когда цена долгое время остается в рамках диапазона, где хорошо обозначены границы. Во время флэта цена часто подходит близко к границам, однако выйти за границы не может. Активность рынка в это время минимальная. Очень часто на ночной сессии наблюдается флет. Когда граница такого бокового движения будет пробита, то это указывает на то, что флэт завершен и начинает развиваться новое трендовое движение.

Read More

Как понимание корреляции между активами поможет вам добиться успеха в трейдинге

Торговля на финансовых рынках требует не только чутья, но и глубоких знаний

Так, корреляция помогает определить, движутся ли цены активов в одном направлении (положительная корреляция) или противоположных (отрицательная корреляция). Понимание корреляции активов — это ключ к разработке гибких и устойчивых торговых стратегий, способных адаптироваться к постоянно меняющимся условиям рынка.

Основы корреляции

Корреляция в трейдинге — это мера, которая показывает, как два или более активов двигаются относительно друг друга на рынке. Это понятие является ключевым для анализа рыночных тенденций и эффективного управления инвестиционным портфелем.

Положительная корреляция означает, что активы двигаются в одном направлении. Например, цены на золото и серебро часто растут и падают вместе, а значит, между ними существует положительная корреляция.

Отрицательная корреляция, напротив, означает, что когда один актив растет в цене, другой — падает. Примером может служить отношение между ценами на нефть и некоторыми авиакомпаниями. Обычно, когда стоимость нефти растет, стоимость акций авиакомпаний снижается из-за увеличения расходов на топливо.

Read More

Как правильно инвестировать в акции

Сегодня практически каждый слышал про то, что инвестирование в акции может стабильно приносить высокий пассивный доход. Примеров много: от великих финансистов, до самых обычных людей. Опыт все больше показывает, что для успеха в инвестировании не обязательно иметь высшее образование или работать в крупных инвестиционных фондах.

Успешные люди говорят, что бедность — это результат неправильных действий, а богатство и успех — правильных.

Как начать инвестировать в акции? В какие акции лучше инвестировать деньги? Как опережать рынок? Ответы на эти и многие другие вопросы читайте дальше в статье.

Read More

Guide for beginner traders. Metals trading

Metals such as gold and silver have a rich history of use as a medium of exchange, store of value, and investment asset. They attract the attention of traders with their stability and demand in the market. At the same time, metals have unique characteristics that make them interesting objects for analysis and trading.


Metals trading provides traders with many opportunities for profitable trading and investing. In this article, we will look at various aspects of metals trading, starting with an overview of the different types of metals and their characteristics as financial assets.

Why do traders choose metals as a trading instrument?

Metals attract traders for several reasons:

  • Diversity of assets. There is a wide variety of assets available in the metals market, allowing traders to select options that suit their strategy and goals.
  • Portfolio diversification. Investing in metals serves as a means of diversifying an investment portfolio.
  • Inflation protection. Precious metals such as gold and silver are often seen as safe haven assets against inflation and economic instability. Traders use them as a tool to preserve the value of capital.
  • Liquidity. Most metal markets are characterized by high liquidity, which allows for prompt entry into transactions and their closure.

Overview of metals available for trading

  • Gold. This precious metal is known for its stability in times of crisis, making it a desirable asset for diversifying investments.
  • Silver. Despite its lower cost compared to gold, silver is in demand as an investment asset due to its wide range of industrial uses.
  • Platinum. A rare metal that is used in the automotive and jewelry industries. This makes it attractive to investors.
  • Copper. Copper’s key role in electrical engineering makes it an important economic indicator reflecting the health of the industry.
  • Aluminum. Lightness and strength make aluminum indispensable in the transport and construction industries, as well as in packaging production.
  • Zinc. The main use of zinc is to protect steel from corrosion, which plays a key role in the construction and automotive industries.
  • Nickel. Essential for the creation of alloys and batteries, nickel plays an important role in modern technology and energy.

Metals market analysis

Analyzing metal markets is the key to success in trading. Let’s look at the main elements of fundamental and technical analysis of these markets, as well as the indicators and tools traders need to make informed decisions.

Fundamental Analysis

Fundamental analysis is based on a thorough study of the factors that determine the supply and demand of metals. Key fundamental aspects include:

  • Economic data. Traders track economic indicators such as GDP, consumer price index (CPI) and manufacturing activity to understand the current state of the economy and potential demand for metals.
  • Geopolitical events. Conflicts, trade wars and political events can affect metal prices. For example, instability in metal-producing countries could lead to a reduction in supply.
  • Seasonal factors. Some metals are subject to seasonal fluctuations in demand, such as holidays or construction seasons.
  • Macroeconomic events. Central bank decisions on interest rates and exchange rate policies also affect metal prices.

Technical analysis

This method is based on studying past price data and trading volume to predict future price movements. Technical analysis of metal markets includes the following aspects:

  • Price charts. Analysts use price charts and candlestick patterns to identify trends and key support and resistance levels.
  • Indicators. Technical indicators such as moving averages, relative strength index (RSI) and stochastic oscillator help assess whether metals are overbought or oversold and predict trend reversals.
  • Trading strategies. Using technical analysis data, traders develop trading strategies, including tactics based on reversals, breakouts and long-term investments.

Based on their trading strategies and investment goals, traders determine how to choose between fundamental and technical analysis, and consider combining them for more effective trading.

RU: Какие бывают торговые сессии. Расписание по Москве

Что такое торговая сессия в трейдинге?

Торговая сессия — время, в которое возможна торговля определенным видом активов на определенной площадке. Часы сессии варьируются в зависимости от класса активов, конкретной биржевой площадки и ее географического положения.

Какие бывают торговые сессии

Какое время максимально комфортно для трейдинга?

Форекс функционирует на протяжении всех суток в будни. И это понятно — везде свои часовые пояса. Валютный кэш нужен крупнейшим игрокам, включая центробанки и крупнейшие корпорации, на постоянной, бесперебойной основе.

Веллингтон — маленькая биржа с маленькими объемами. Поэтому настоящий активный трейдинг начинается после пробуждения Австралии (Сидней) и Японии (Токио). В это время в фокусе внимания трейдеров — иена, юань, сингапурский доллар и т.д.

Торгуемые обороты достигают максимальных значений после активации лондонских торгов. Это топовая биржа с максимальными объемами. Здесь максимально активны миллиардные инвестфонды и банки Европы.

Далее, когда лондонские трейдеры идут обедать — в игру вступает Нью-Йорк, номер два по оборотам Форекс-биржа.

Пиковый по реализуемым оборотам трейдинг происходит в лондонское дневное время и в нью-йоркское утро. После закрытия лондонской площадки американская биржа — самое популярное торговое место вплоть до конца дня.

Минимально активное время — пересечение окончания сессии в США и открытия новозеландской сессии. Ну и после открытия Австралии торговля заходит на очередной повторяющийся цикл.

Европейская, американская и азиатские сессии: когда начинаются

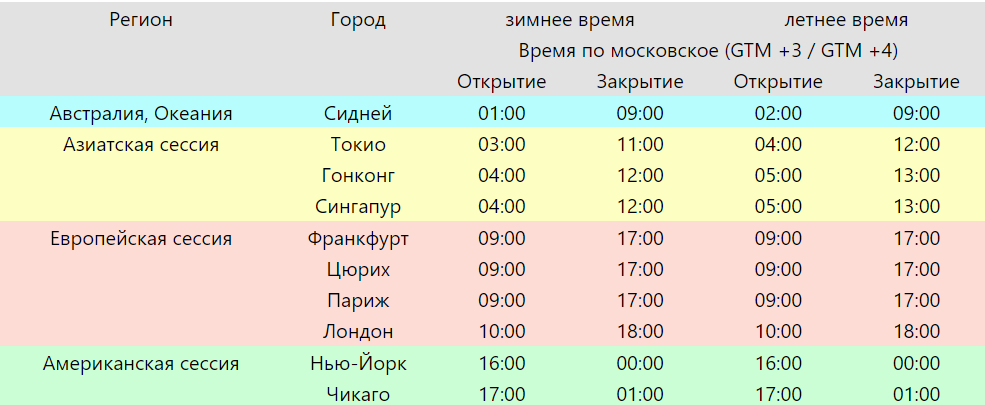
Исторически в расписании Форекс-сессией выделяют три главных временных отрезка (МСК +3 GTM (+4 GTM)):

  • Азиатская сессия: 03:00 – 11:00 (04:00 – 12:00 по летнему времени);
  • Европейская сессия: 09:00 – 17:00 (10:00 – 18:00 по летнему времени);
  • Американская сессия: 16:00 – 24:00 (17:00 – 01:00 по летнему времени).

Трейдеры живут в разных часовых поясах. Чтобы не возникло путаницы по времени, удобнее всего пользоваться вот такой таблицей.

Расписание торговых сессий по московскому времени

Расписание торговых сессий по московскому времени
price of a currency

What is the price of a currency and what does it depend on?

Currency price. Visitors to our site know that currency can not only be a means of payment, it can also be a product that can be bought or sold. If all the states of the world used one currency, then it would be difficult to talk about its commodity function. But the world works differently. Most countries issue and use their national currency. This is what you can buy with the currency of another country.

But in this case, the question arises of the price at which such a trading operation can be carried out. The exchange rate allows you to determine this price. What is it? How are exchange rates calculated? We will try to answer these questions.


  • What is the exchange rate?
  • Types of exchange rates
  • Currency convertibility
  • Types of currency convertibility
  • Factors influencing the value of a currency
  • Conclusion


What is the exchange rate?


So, what is an exchange rate? It is generally accepted that the exchange rate is the price of the currency of one country expressed in the currency of another.

One of the main criteria when determining the exchange rate is the purchasing power that the currency has. In economic theory there is a law of one price. Based on this law, the basic value of the national currency exchange rate is determined. The calculation is carried out in the following sequence:

The assumption is made that the value of a product remains constant in any country, no matter where it is located.
The product is valued in national currency (Pd).
The same product is valued in foreign currency (Pf).
The ratio of these prices will be the desired value of the exchange rate of the national currency to the foreign currency.


Types of exchange rates


It is important not only to understand what the exchange rate is. Its types are also of great importance for understanding the essence of commodity-money relations. There are the following types of exchange rates:

  • Market. The exchange rate formed under the influence of market factors, the main of which are supply and demand, is considered market rate. Investors’ interest in currencies is inconsistent. Therefore, the market rate is in constant motion. A currency rises when there is increased demand for it and there is a lack of supply, and a fall occurs when supply exceeds demand.
  • Official. The rate established by the decision of the national regulator is official. It can be set for different time periods. If the official exchange rate does not correspond to the market rate, the regulator must do everything in its power to minimize this discrepancy.
  • Exchange. This rate means the price at which currency is currently being purchased or sold on the exchange. For example, when the euro/dollar exchange rate falls on the stock exchange, it is profitable to buy euros at the exchange rate, spending a minimum amount of dollars on it.
  • Buyer’s rate. In market conditions, there is a price that a buyer is willing to pay for a particular currency. It is this price that determines the buyer’s rate. It is also considered that at this rate the resident bank makes the purchase of foreign currency.
  • Seller’s course. There are different interpretations of this exchange rate, but the essence comes down to the following – this is the lowest price at which the currency seller is ready to make a transaction.
  • Exchange rate. This rate allows you to find out how many units of national currency you need to have on hand to purchase a unit of foreign currency. Typically, the exchange rate consists of two prices – the purchase price of the currency and the sale price.


The exchange rate and its types can operate in a certain mode. There are two such modes:


  • Floating. In this mode, the state does not have a decisive influence on the exchange rate. Its formation is influenced only by market factors, and exchange rate movements occur as a result of changing supply and demand.
  • Fixed. The state, through its financial regulatory authorities, sets a fixed value for the national currency exchange rate. It can be established for a certain period or operate continuously.


Currency convertibility


Speaking about exchange rates, one cannot fail to mention such a concept as convertibility, which determines the ability of a currency to be freely exchanged for one another. The degree of convertibility of a particular currency depends on the decision of the relevant government body entrusted with the function of currency regulation.


It is generally accepted that the convertibility of currency issued by a state is one of the main indicators of the openness of the economy of this state, its ability to compete on equal terms in the global labor and capital markets.


Types of currency convertibility


In practical application, currency convertibility is divided into types, the main ones being the following:

Full convertibility. This type of convertibility implies free access for all residents and non-residents to unlimited exchange of national currency for foreign currency. Only countries with developed economies can afford this type of conversion. The only freely convertible currencies include the US dollar, British pound, Japanese yen and euro.
Partial convertibility. In conditions of partial convertibility, transactions with the national currency are subject to restrictions by the issuing state, allowing it to be exchanged only for a certain list of foreign currencies.
Internal convertibility. Under the conditions of this type of convertibility, only residents are given the right to purchase foreign currency for making foreign economic payments.
External convertibility. This type of convertibility allows only foreign citizens and companies to bring their capital into the country and exchange it for the national currency.
Closed currency. If there is a ban on the part of the issuing state on the exchange of national currency for foreign currency, this currency will be considered inconvertible (closed). It can function only in a limited territory of the state that issued this currency into circulation.


Factors influencing the value of a currency

Macroeconomic indicators of the state


  • Foreign trade balance of the country. If exports of goods and services exceed imports, this will have a positive effect on the value of the national currency. As the country’s gold and foreign exchange reserves grow, the national currency strengthens and its value becomes higher.
  • Inflation rate within the country. The exchange rate of a currency directly depends on its purchasing power. A high inflation rate in a country leads to a decrease in the purchasing power of the national currency, which means that its value falls.
  • Dynamics of gross domestic product (GDP). GDP growth has a positive effect on the value of the national currency, since with its growth the inflation rate decreases and, as a rule, the influx of foreign investment increases.
  • Budget deficit level. The balance of the state budget, the absence of additional emission of money that is not supported by the gross domestic product, allows the national currency to strengthen.
  • Government debt obligations. With an increase in public debt to foreign creditors, the burden on the country’s balance of payments increases. Debt servicing leads to an outflow of foreign currency from the country, as a result of which the demand for it increases and the depreciation of the national currency.


State monetary policy


  • Foreign exchange intervention carried out by a national bank. The bank independently enters the market and buys or sells currency, which in the short term affects the value of the national currency and its stability.
  • National bank interest rate. The bank’s board can change the level of the discount rate, which affects the value of the currency. Lowering the interest rate contributes to the revival of the national market, GDP growth and the availability of loans for individuals and legal entities. As a result, the national currency rate strengthens. But at the same time, investors are not interested in low interest rates. They withdraw foreign currency from the country, which in the long term negatively affects the value of the national currency.

Socio-political situation in the country. The currency is very sensitive to any events taking place in the state. Its cost is negatively affected by:

  • Military conflicts.
  • Strikes and civil strife.
  • Unconstitutional change of power.
  • Violation of the territorial integrity of the state.
  • Instability of legislation relating to currency regulation.


The price of a currency depends on many factors. Moreover, this dependence in most cases is ambiguous. The market reacts very sluggishly to some events and the price practically does not change. Other seemingly insignificant events cause panic in the market, and the price of the currency rapidly changes in one direction or another.