Trading in financial markets requires not only instinct, but also deep knowledge.
Thus, correlation helps determine whether asset prices are moving in the same direction (positive correlation) or in opposite directions (negative correlation). Understanding asset correlation is key to developing flexible and resilient trading strategies that can adapt to ever-changing market conditions. Read More
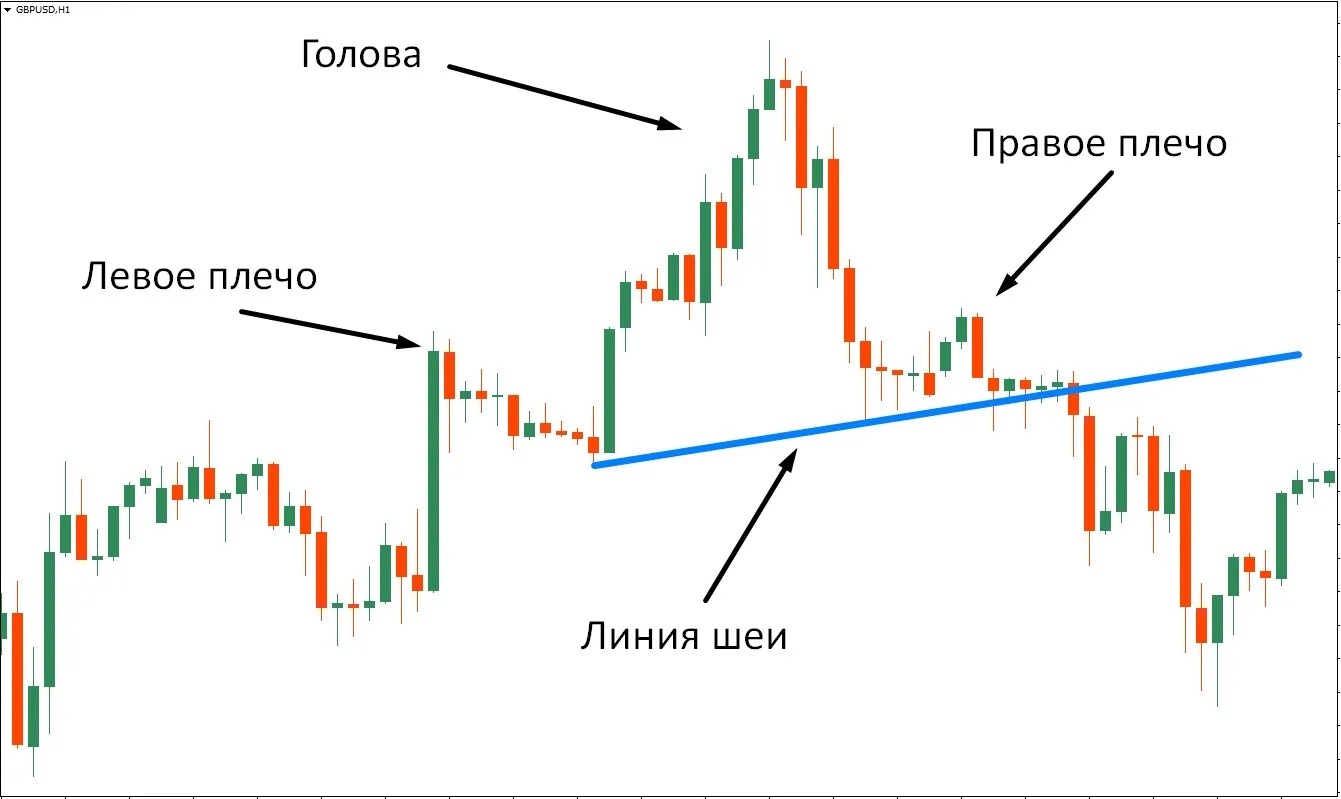
Выделить паттерн на графике можно по соответствию описания. Если мы видим левое плечо, голову и правое плечо, то после этого можно переходить к важному построению, которое позволит найти точку входа. Для этого нам нужно провести особую линию, которая называется линией шеи. Делается это после того, как у нас сформировалась сама голова, а правое плечо еще образуется. Соединяем точку начала головы и точку ее окончания, воспользовавшись инструментом линия в торговой платформе. В большинстве случаев она имеет наклон, желательно, чтобы линия была направлена вверх. Следующий этап заключается в том, чтобы открыть сделку по одному из предлагаемых сценариев:
Отложенный ордер на пробой образованной линии шеи. Располагаем прямо под ней.
Ждем, когда цена отскочит от линии и ставим отложенный ордер на пробой этого локального минимума.
Дожидаемся ретеста линии шеи.
. Это один из самых простых и одновременно эффективных методов анализа, в основе которого лежат наблюдения за рыночным поведением и формированием шаблонов. Каждый из шаблонов формируется последовательностью движений, которые образуют описанную форму или же имеют заданные соотношения между составляющими их элементами. Если увиденное на графике соответствует описанию, можно открывать сделку. Простейшим примером такой фигуры является Голова и плечи. Точка входа, однако же, иногда вызывает сложности у новичков. Найти ее могут не все, и из-за этого пропускается множество возможностей заработать на развороте тренда. Опишем построение и расскажем, как открывать сделки по паттерну.
Фигуры Голова и Плечи
Третий вариант достаточно консервативен, он предполагает вход по уже начавшей отрабатывать фигуре. Отметим, что ретест может не состояться. Если трейдер торгует только таким образом, то часть образующихся фигуры графического анализа форекс
Разбор всех методов входа в паттерн Голова и Плечи
Трудно найти более простую фигуру, чем Голова и плечи. Два зигзага, которые направлены в разные стороны и идут друг за другом несложно идентифицировать на графике. Но у этого паттерна есть некоторые особенности, которые рекомендуется учитывать при торговле. Выделим главное:
Если Голова и плечи образуются около технических уровней, то это в значительной степени повышает вероятность отработки. Подойдут фибоуровни, Ганн, Мюррей и обычные сопротивления (для перевёрнутого паттерна это будут поддержки);
Чем старше период графика, тем точнее работает модель. Обычно ГиП рассматривают от Н1 и выше, оптимально торговать на четырёхчасовом периоде;
Рекомендуется торговать только те инструменты, которые представляют большой интерес для рынка и обладают высоким показателем ликвидности. Среди валютных пар это основные и некоторые кроссы, на фондовом секторе индексы и голубые фишки.
Где ставить стоп-лоссы при торговле по паттерну Голова и Плечи?
На форексе эффективность обычной ГиП и перевернутой примерно одинаковая, но на фондовых инструментах рекомендуется работать с перевернутой. Объясняется это достаточно просто – падения акций обычно происходят очень динамично, разворот также формируется быстро. В то же время движение вверх может быть медленным, часто образуются сигналы разворота, которые не отрабатывают. Обучение фундаментальному анализу акций рассматривает этот момент и объясняет паникой на рынке. В остальном ГиП универсальна и предполагает высокую точность при работе в рамках описанных выше рекомендаций.
он будет пропускать. В качестве промежуточного варианта можно предложить разделение своего рабочего лота на 3 равные части. Каждая из них открывается по одному из трех описанных вариантов. Это снижает риск пропустить вход и повышает вероятность успеха, а также уменьшает потенциальный стоп-лосс в итоговом выражении. Ограничение убытков, как правило, устанавливают за правое плечо. Расстояние, на которое цена двигается после пробоя линии шеи обычно составляет как минимум диапазон самой фигуры. Иногда движение развивается динамично и есть возможность взять больше пунктов. Можно фиксировать прибыль частями. Например, через каждые 50-100 пунктов. Интервал устанавливается исходя из того, на каком таймфрейме образовалась фигура и какой ее общий диапазон.
Наверняка вы знаете, что 80% времени на рынке – флет. В это время котировки находятся в узком ценовом коридоре и двигаются от одной его границы к другой. Трейдеры до сих пор спорят, стоит ли заниматься торговлей во флете. Давайте разберемся, стоит ли игра свеч, и есть ли риски?
Что представляет собой флет на Форекс?
Флет – это особое состояние рынка, когда цена долгое время остается в рамках диапазона, где хорошо обозначены границы. Во время флэта цена часто подходит близко к границам, однако выйти за границы не может. Активность рынка в это время минимальная. Очень часто на ночной сессии наблюдается флет. Когда граница такого бокового движения будет пробита, то это указывает на то, что флэт завершен и начинает развиваться новое трендовое движение.
Торговля на финансовых рынках требует не только чутья, но и глубоких знаний
Так, корреляция помогает определить, движутся ли цены активов в одном направлении (положительная корреляция) или противоположных (отрицательная корреляция). Понимание корреляции активов — это ключ к разработке гибких и устойчивых торговых стратегий, способных адаптироваться к постоянно меняющимся условиям рынка.
Основы корреляции
Корреляция в трейдинге — это мера, которая показывает, как два или более активов двигаются относительно друг друга на рынке. Это понятие является ключевым для анализа рыночных тенденций и эффективного управления инвестиционным портфелем.
Положительная корреляция означает, что активы двигаются в одном направлении. Например, цены на золото и серебро часто растут и падают вместе, а значит, между ними существует положительная корреляция.
Отрицательная корреляция, напротив, означает, что когда один актив растет в цене, другой — падает. Примером может служить отношение между ценами на нефть и некоторыми авиакомпаниями. Обычно, когда стоимость нефти растет, стоимость акций авиакомпаний снижается из-за увеличения расходов на топливо.
Сегодня практически каждый слышал про то, что инвестирование в акции может стабильно приносить высокий пассивный доход. Примеров много: от великих финансистов, до самых обычных людей. Опыт все больше показывает, что для успеха в инвестировании не обязательно иметь высшее образование или работать в крупных инвестиционных фондах.
Успешные люди говорят, что бедность — это результат неправильных действий, а богатство и успех — правильных.
Как начать инвестировать в акции? В какие акции лучше инвестировать деньги? Как опережать рынок? Ответы на эти и многие другие вопросы читайте дальше в статье.
Brent Crude and WTI (West Texas Intermediate) are two of the most common crude oils used in global trade. When choosing between them, consider the following factors:
Metals such as gold and silver have a rich history of use as a medium of exchange, store of value, and investment asset. They attract the attention of traders with their stability and demand in the market. At the same time, metals have unique characteristics that make them interesting objects for analysis and trading.
Metals trading provides traders with many opportunities for profitable trading and investing. In this article, we will look at various aspects of metals trading, starting with an overview of the different types of metals and their characteristics as financial assets.
Why do traders choose metals as a trading instrument?
Metals attract traders for several reasons:
Diversity of assets. There is a wide variety of assets available in the metals market, allowing traders to select options that suit their strategy and goals.
Portfolio diversification. Investing in metals serves as a means of diversifying an investment portfolio.
Inflation protection. Precious metals such as gold and silver are often seen as safe haven assets against inflation and economic instability. Traders use them as a tool to preserve the value of capital.
Liquidity. Most metal markets are characterized by high liquidity, which allows for prompt entry into transactions and their closure.
Overview of metals available for trading
Gold. This precious metal is known for its stability in times of crisis, making it a desirable asset for diversifying investments.
Silver. Despite its lower cost compared to gold, silver is in demand as an investment asset due to its wide range of industrial uses.
Platinum. A rare metal that is used in the automotive and jewelry industries. This makes it attractive to investors.
Copper. Copper’s key role in electrical engineering makes it an important economic indicator reflecting the health of the industry.
Aluminum. Lightness and strength make aluminum indispensable in the transport and construction industries, as well as in packaging production.
Zinc. The main use of zinc is to protect steel from corrosion, which plays a key role in the construction and automotive industries.
Nickel. Essential for the creation of alloys and batteries, nickel plays an important role in modern technology and energy.
Metals market analysis
Analyzing metal markets is the key to success in trading. Let’s look at the main elements of fundamental and technical analysis of these markets, as well as the indicators and tools traders need to make informed decisions.
Fundamental Analysis
Fundamental analysis is based on a thorough study of the factors that determine the supply and demand of metals. Key fundamental aspects include:
Economic data. Traders track economic indicators such as GDP, consumer price index (CPI) and manufacturing activity to understand the current state of the economy and potential demand for metals.
Geopolitical events. Conflicts, trade wars and political events can affect metal prices. For example, instability in metal-producing countries could lead to a reduction in supply.
Seasonal factors. Some metals are subject to seasonal fluctuations in demand, such as holidays or construction seasons.
Macroeconomic events. Central bank decisions on interest rates and exchange rate policies also affect metal prices.
Technical analysis
This method is based on studying past price data and trading volume to predict future price movements. Technical analysis of metal markets includes the following aspects:
Price charts. Analysts use price charts and candlestick patterns to identify trends and key support and resistance levels.
Indicators. Technical indicators such as moving averages, relative strength index (RSI) and stochastic oscillator help assess whether metals are overbought or oversold and predict trend reversals.
Trading strategies. Using technical analysis data, traders develop trading strategies, including tactics based on reversals, breakouts and long-term investments.
Based on their trading strategies and investment goals, traders determine how to choose between fundamental and technical analysis, and consider combining them for more effective trading.
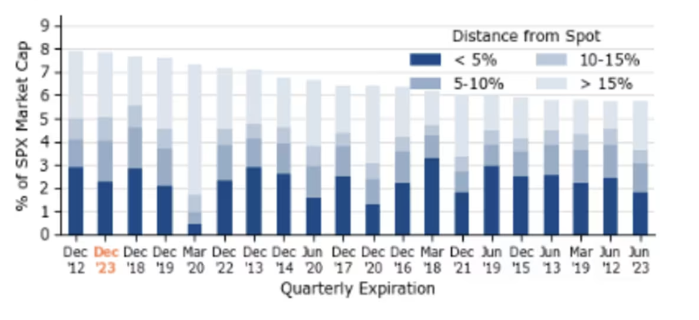
More than $5 trillion worth of stock options, index options and stock index futures expire today. In addition, the S&P 500 and Nasdaq-100 will be rebalanced on the same day
More than $5 trillion worth of stock options, index options and stock index futures expire today. In addition, the S&P 500 and Nasdaq-100 will be rebalanced on the same day
The redemption volume reaches 8% of the SPX market capitalization. This is the maximum since 2012. Source: Google
Analysts warn that events could move quickly and volatility could be off the charts as billions of dollars worth of contracts and securities change hands on this day. The face value of options expiring today is $5.3 trillion, with the largest redemptions taking place before the start of the American session.
On the one hand, many traders will take profits on bullish positions, but some will choose to roll them over to the next period to maintain risk hedging. Index fund managers will have to complete adjustments to their holdings before the announced index changes take effect.
Trading volumes have been growing since the beginning of the week. On the American stock market, stock trading volume reached $17 billion, Steve Sosnick, chief market strategist at Interactive Brokers, said this during a telephone interview with News. For comparison: on Tuesday, trading volume did not exceed $10.6 billion.
“Tomorrow the volume of trade in popular categories will be huge,” Sosnik added. “This is the largest option expiration of the year, which is understandable, December is always like this. But that is not all. Today’s event will likely be the largest redemption of SPX options in the last ten years,” Fishman said in comments to MarketWatch.
Brent Kochuba, founder of options market analytics platform Spotgamma, went even further, saying “this is the largest options redemption ever.”
There is a distortion in the market
Traders were buying bull options at a record pace amid surging markets, according to data from Cboe Global Markets, the largest operator of options exchanges in the United States. Trading volume in S&P500-related options reached 4.8 million contracts on Thursday, surpassing the previous all-time high reached on November 14, according to Cboe. Additionally, total trading volume in call options on all U.S. stocks topped 30 million contracts on Wednesday, marking the strongest bullish contract activity this year, according to Goldman Sachs Group.
Aggressive stock buying over the past month has helped push the S&P 500 close to an all-time high (based on closing prices), options market experts say. The S&P 500 SPX rose 8.9% in November, which was the best month of 2023 of the year and the eighteenth-best month in the last 73 years. It continued to rise in December, according to FactSet data. Since the beginning of the month, the index has risen by 3.3%.
Earlier this week, analysts warned that markets could face trouble as the S&P 500 approaches the 4,600 level. They explained that a “wall” of open interest in call options near that level could force market makers to put the brakes on the rally. However, traders knocked down that wall and pushed the index to 4700. The S&P 500 closed at 4719.55 on Thursday, its highest close since Jan. 12, 2022, according to FactSet data. The index is currently within 1.75% of its record close set on January 3, 2022 at 4796.56.
Traders’ bullish sentiment recently helped push the Cboe VIX volatility index, also known as Wall Street’s “fear gauge,” to multi-year lows.
It’s not just options and S&P 500 contracts tied to popular stocks like Tesla Inc. that generate volume. Call options trading volume tied to the iShares Russell 2000 ETF IWM (which tracks small-cap companies in the Russell 2000 Index) reached 1.35 million contracts, the third-highest ever, according to Goldman. Activity in options contracts related to small-cap stock indexes has been increasing since late October.
Heavy call option buying has driven the S&P 500 put-call ratio to its lowest level in a year, according to Goldman Sachs Group. This suggests that investors were buying up bullish contracts but avoiding bearish ones due to the sustained rise in the stock market. Goldman analysts are calling Friday “the last big event of the year.”
A unique coincidence of circumstances
“Triple Witching Friday” or “Witch Friday” happens once a quarter. On this day, futures on stock indexes, as well as options linked to individual stocks, ETFs and indices, expire. Experts note that they are usually characterized by more intraday fluctuations and higher trading volume.
This time the S&P 500 and Nasdaq-100 will be rebalanced after the markets close on Friday. This is typically a routine event, but it came into the spotlight this quarter because funds were forced to rebalance over the summer to limit exposure to large-cap Nasdaq-100 stocks.
Earlier this month, Standard & Poor’s announced its rebalancing plans, which included reducing the weighting of shares of Apple Inc and Alphabet Inc. GOOG, -0.57% GOOGL, -0.48%. At the same time, Amazon’s share. com will be increased. Three companies, including Uber Inc, will also join the index, while three others will leave it.
Kochuba believes this Friday’s expiration could remove the final barrier holding stocks back to record highs for the rest of the year.
“After OpEx, markets will no longer be held back,” he noted. OptionMetrics’ Garrett DeSimone cautioned that investors shouldn’t put too much weight on options market activity and other technical factors.
“At the end of the day, it’s all about macroeconomics,” he told News.
Торговая сессия — время, в которое возможна торговля определенным видом активов на определенной площадке. Часы сессии варьируются в зависимости от класса активов, конкретной биржевой площадки и ее географического положения.
Какие бывают торговые сессии
Какое время максимально комфортно для трейдинга?
Форекс функционирует на протяжении всех суток в будни. И это понятно — везде свои часовые пояса. Валютный кэш нужен крупнейшим игрокам, включая центробанки и крупнейшие корпорации, на постоянной, бесперебойной основе.
Веллингтон — маленькая биржа с маленькими объемами. Поэтому настоящий активный трейдинг начинается после пробуждения Австралии (Сидней) и Японии (Токио). В это время в фокусе внимания трейдеров — иена, юань, сингапурский доллар и т.д.
Торгуемые обороты достигают максимальных значений после активации лондонских торгов. Это топовая биржа с максимальными объемами. Здесь максимально активны миллиардные инвестфонды и банки Европы.
Далее, когда лондонские трейдеры идут обедать — в игру вступает Нью-Йорк, номер два по оборотам Форекс-биржа.
Пиковый по реализуемым оборотам трейдинг происходит в лондонское дневное время и в нью-йоркское утро. После закрытия лондонской площадки американская биржа — самое популярное торговое место вплоть до конца дня.
Минимально активное время — пересечение окончания сессии в США и открытия новозеландской сессии. Ну и после открытия Австралии торговля заходит на очередной повторяющийся цикл.
Европейская, американская и азиатские сессии: когда начинаются
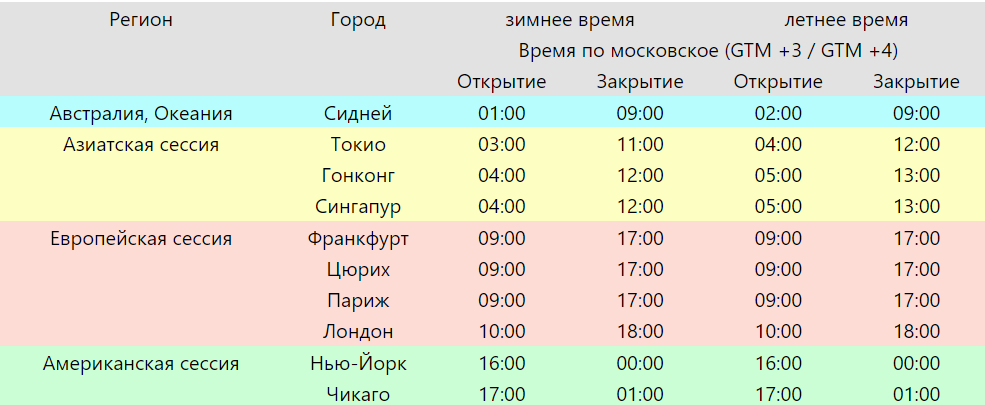
Исторически в расписании Форекс-сессией выделяют три главных временных отрезка (МСК +3 GTM (+4 GTM)):
Moderna’s CEO said the company’s experimental melanoma vaccine could be available by 2025.The company’s shares reacted with rapid growth
Shares of biotech company Moderna rose 20.78% to $94.93 on the NASDAQ stock exchange as of 5:43 p.m. Moscow time.Demand for the stock surged amid Moderna CEO Stephane Bancel’s announcement that the company’s experimental melanoma vaccine could become available in just two years.According to the CEO, Moderna expects the product could be launched on an accelerated basis in some countries by 2025, Barron’s writes.According to the publication, in 2020, 325 thousand new cases of melanoma and 57 thousand deaths from this disease were registered worldwide.Unlike conventional vaccines, so-called therapeutic vaccines treat rather than prevent disease.
Clinical trial results showed improved chances of survival over time with the vaccine, which uses the same messenger RNA technology that has been shown to be highly effective against severe forms of COVID-19.Creating a cancer vaccine involves analyzing the genetic sequence of each patient’s tumor to create personalized therapy after surgery.The study involved 157 people diagnosed with stage III–IV melanoma.Moderna’s experimental vaccine combined with Merck’s immunotherapy drug Keytruda reduced the risk of relapse or death by 49% over three years compared with Keytruda alone.
Last year, Moderna announced the results of two years of monitoring, which showed a 44% reduction in risk.Thus, existing clinical data could form the basis for conditional approval of the vaccine, Bancel said.Modern’s shares have fallen by about 48% since the beginning of the year.At the end of the third quarter of 2023, the biotechnology company reported a net loss of $3.6 billion. The company attributed the loss mainly to one-time write-offs associated with reduced capacity to produce COVID-19 vaccines.The company’s revenue decreased by 1.8 times – to $1.831 billion. The company announced that it plans to reach breakeven in 2026.