One of the reversal patterns on the chart is head and shoulders. This model has clear rules for construction and identification. However, there are some of its configurations that also indicate a trend reversal.
Reversal patterns of technical analysis
Before changing direction, the prevailing trend in the market will give a signal. This is what the founder of technical analysis, Charles Dow, said. Based on how the price behaves, we can draw a conclusion about what is happening with the balance of power in the market.
When a trend changes from upward to downward, one of three patterns can be seen on the chart: head and shoulders, double top and triple top. They are sometimes confused by calling double top and double head and shoulders.
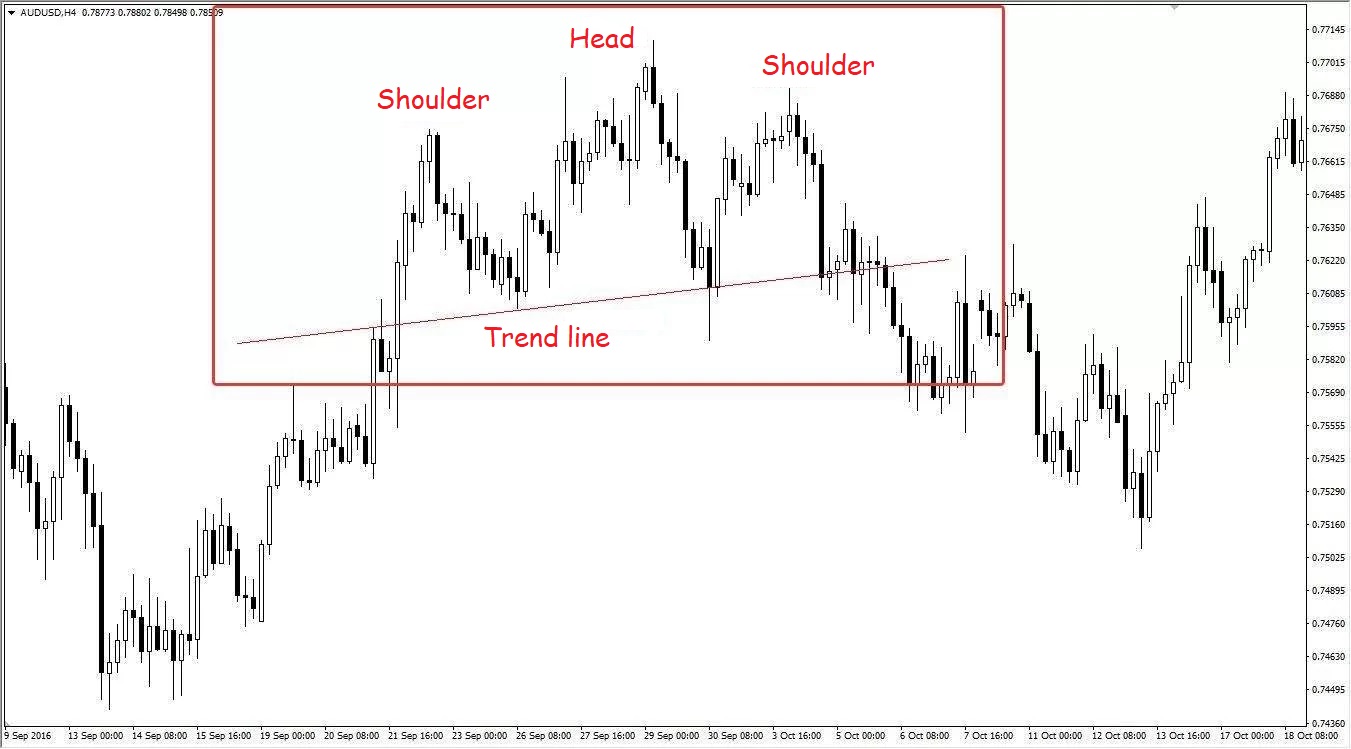
Head and shoulders
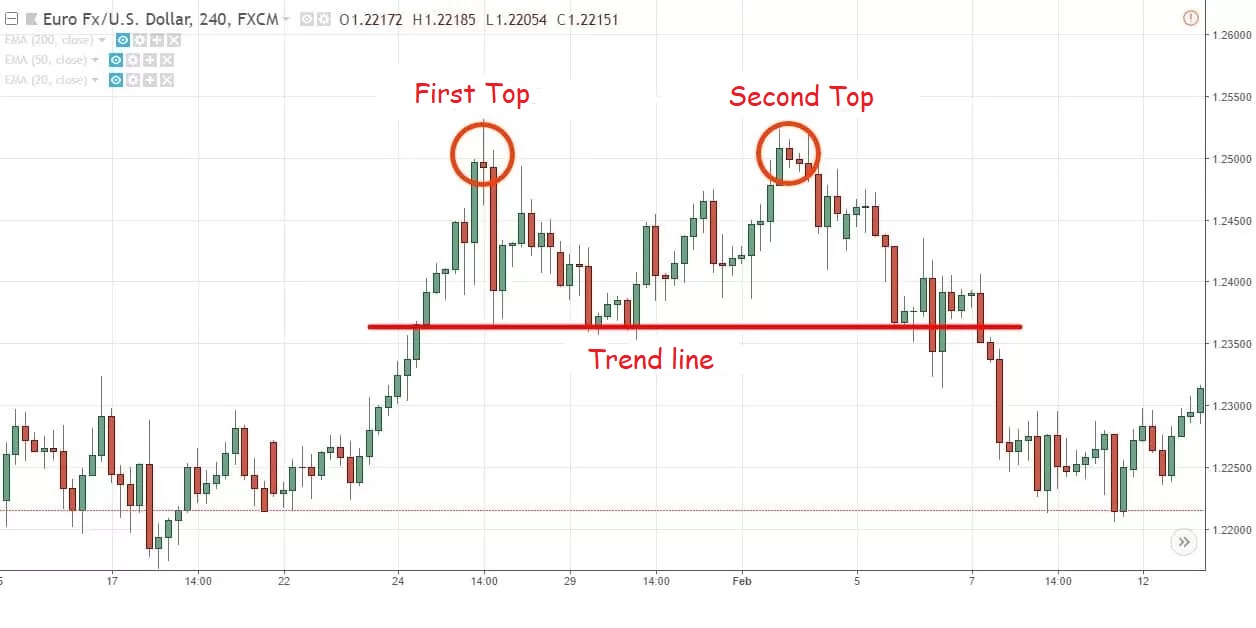
double top
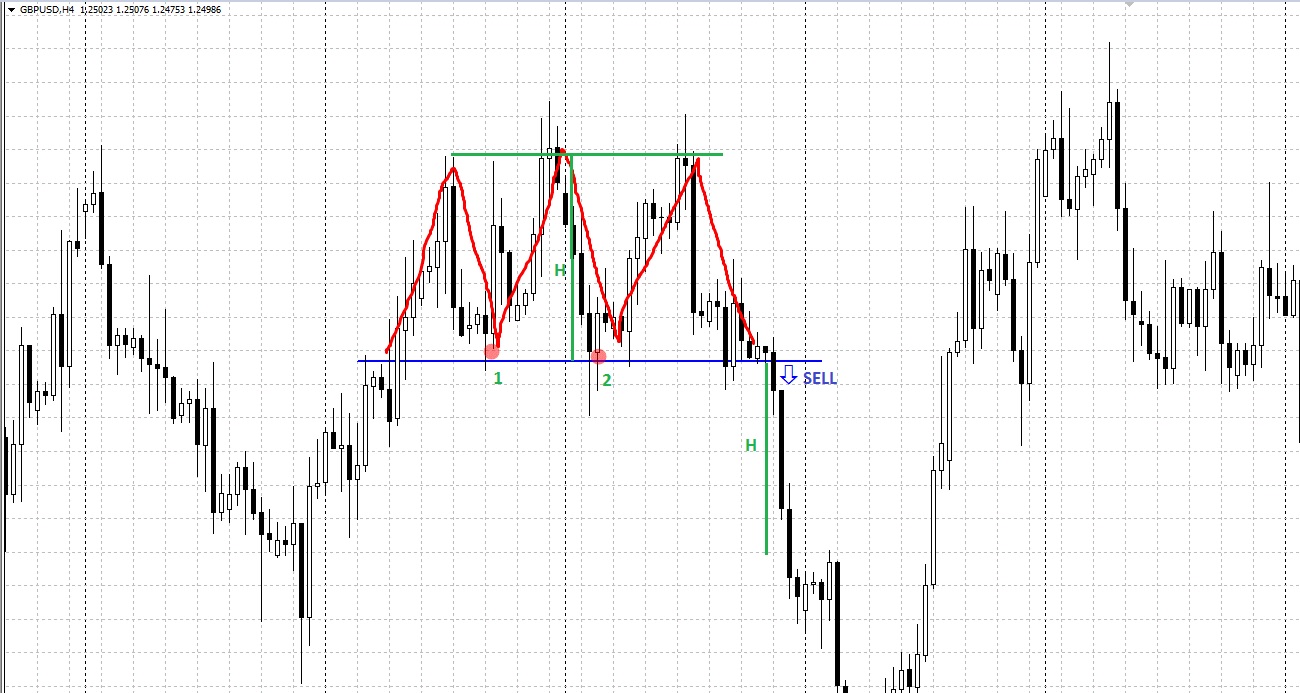
triple top
To understand why a reversal occurs, you need to know what a head and shoulders pattern means. Price growth in an upward trend is due to the dominance of buyers. After the growth stage, some players take profits, provoking a downward correction. However, in an uptrend, each subsequent low and high are higher than the previous one.
The moment a head and shoulders, double top or triple top (a variation of the head and shoulders pattern) appears on the chart, it becomes clear that the price cannot overcome the previous high. This means that the strength of the bulls is weakening, and dominance is passing to sellers, foreshadowing a break in the trend.
How does the head and shoulders pattern work?
Regardless of whether a double head and shoulders, double or triple top pattern appears on the chart, these patterns trade approximately the same.
First, it is necessary to correctly define the model – it must be preceded by an upward trend. In a downward trend, these figures will be formed in a mirror image: triple and double bottoms, head and shoulders inverted (inverse) will be signals of a change from a downward trend to an upward one.
Secondly, using the lows of the figures formed at the top of the uptrend, it is necessary to draw a neckline. This is the border, upon the breakdown of which a bearish signal is formed.
A sell trade must be placed after the neck line is broken. Already on the next candle after the breakout, which has opened and is forming below the level, you can open a position.
To determine the target and take profit, it is necessary to measure the height of the figure’s head or the overall height of the pattern if we are talking about a double or triple top pattern. It must be moved down from the breakout line and a take profit should be set there.
