Heiken Ashi - Хейкин-Аши

The Heiken Ashi indicator: what is it and how to use it

Heiken Ashi - Хейкин-АшиHeikinAshi is a Japanese trading indicator and a type of financial chart, the name of which translates as “medium bar”.

Heikin-Ashi charts are similar to candle charts, but differ in a smoother and smoother appearance, since they capture a range of price movements, rather than each individual price fluctuation, as traditional candles do.

The indicator was developed in the 1700s by Munehisa Homma, who is also the author of candle charts.

These charts are actively used by traders and investors to analyze and predict price movements.

Many traders use multifunctional variants of price charts in their practice, such as Japanese candlesticks and bars, which provide extensive information about the movement of quotations:

they create a visual picture of the market situation at each time interval; They allow you to predict price behavior in the near future based on the recognition of candlestick patterns (which also applies to bars).

The accuracy of the analysis and forecasts depends on various factors, including the level of market noise. In trading systems, participants tend to filter this noise using additional tools such as trend indicators. Romanian financial analyst Dan Valcu has proposed a new way to display quotation charts, which is initially able to eliminate high-frequency fluctuations in the market.

This alternative method is called Heiken Ashi and is distinguished by its method of constructing price bars. Its main feature is the use of prices not only for the current, but also for the previous trading period.

Visually, candlesticks on this indicator are almost identical to traditional Japanese ones:

they have a body limited by the calculated opening and closing prices (Open and Close);
they can be ascending (Open < Close), traditionally white, or descending (Open > Close), red;
they can have upper and lower shadows when the highs and lows of the candle go beyond the body

Building Heiken Ashi Candles

Heiken Ashi (HA) candlesticks are a method of visualizing price movement that uses averaged values to smooth out market noise. This approach allows traders to better assess the current market situation and identify trends. Below are the basic formulas used to build Heiken Ashi candles:

The closing price of the candle in the interval with the ordinal number i is equal to the Weighted Price:

Close_ha[i] = (Close[i] + Open[i] + High[i] + Low[i]) / 4.

The opening price is defined as the average price on the previous Heiken Ashi candle:

Open_ha[i] = (Open_ha[i-1] + Close_ha[i-1]) / 2.

The maximum represents the largest of the opening and closing prices of the current HA candle and the maximum of the current period of the candle chart:

High_ha[i] = Max(Open_ha[i], Close_ha[i], High[i]).

The minimum price is determined similarly, but uses the lowest value and minimum of the current period of the candlestick chart:

Low_ha[i] = Min(Open_ha[i], Close_ha[i], Low[i]).

As a result, the following conclusions can be drawn:

The sequence of Open prices in Heiken Ashi candles is equivalent to the average for two periods with a shift of one bar. This avoids the use of integral formulas, which in turn reduces the delay of the indicator in relation to the price chart.

The body of the Heiken Ashi candle reflects the difference between the real weighted price of the current period and the average price of the previous one. This parameter can be interpreted as the strength of the current price momentum.

Candle shadows are formed when the real highs (High) or lows (Low) exceed the calculated values.

This chart format allows you to quickly and effectively assess the market situation in just one glance.
How to interpret the Heiken Ashi chart

The analysis of the Heiken Ashi chart is based on the specifics of candle formation. Here are the key points for understanding their behavior:

  • A continuous series of candlesticks in one direction indicates the presence of a stable trend.
  • A decrease in the length of the candle bodies may indicate a decrease in the interest of market participants in the current movement, a weakening of the price impulse and an increase in the probability of correction.
  • Candles that do not have shadows directed against the main body show a strong and well-defined tendency.
  • The shadow of the candle, directed in the opposite direction from the body, indicates the growing interest of traders in opening positions against the current trend.
  • Short candlesticks (so-called doji) with long shadows in both directions indicate a high probability of changing the direction of movement or going into a sideways movement (flat).

How to use the HeikenAshi indicator

The Heiken Ashi indicator is included in trading systems as an effective tool for trend analysis. However, its use has its own characteristics.

In particular, for MT4, which is widely used by many forex traders, and for MT5, which is gaining popularity in stock trading, traders have to resort to third-party indicators. The creator of the platform, MetaQuotes, does not yet consider it necessary to add Heiken Ashi as a separate type of graph or include it in a set of standard analysis tools.

In this terminal, Heiken Ashi candles are built on top of one of the standard price charts. This is not very convenient, since the imposition of candles (if Japanese candles are selected as a working option) complicates the perception of information.

There are several ways to improve the display quality:

In the color scheme settings, set the color of the price chart in the same way as the background. In this case, the trader will receive a clean Heiken Ashi chart in the quotation window. However, most of the standard indicators from the delivery package will not be able to work with it. Instead, you will have to download and connect (or write yourself) extended third-party versions that can work with the prices of this chart.

Build a bar price chart. It has almost no effect on the display of Heiken Ashi candlesticks and shows the characteristic prices of periods (Open, Close, High, Low).

Build a price chart in the form of a line (it is drawn at the closing prices of periods). This is convenient for those who build their trading systems with reference to the end of the previous bar and the beginning of the current one.

Place the Heiken Ashi chart at the bottom of the price chart. In this case, the trader gets access to all the information of the standard chart and the results of its processing by this indicator. Such versions of Heiken Ashi can also be found from third-party developers.

The situation with the indicator for QUIK, which has become the standard among Russian traders and investors, is even more complicated. The creator of the platform also does not respond to requests from users to include Heiken Ashi in a set of standard representations of the price chart. The built-in development tools do not allow the formation of candlestick graphic objects on the chart. Therefore, third-party indicators in Lua (the programming language for QUIK) often have rather strange shapes that are inconvenient to work with. The situation can be improved by indicators with alerts that signal significant changes in the behavior of the Heiken Ashi chart. However, such an analysis using machine methods is complex and, accordingly, difficult to implement.
Trading signals and recommendations for working with Heiken Ashi

The Heiken Ashi indicator is often considered as a tool for determining the trend, but experienced traders also use it to receive trading signals:

The first full-bodied candle (rising or falling) with a single shadow in the direction of movement. This may signal the beginning of a trend movement, both upward and downward. After the appearance of such a candle, traders are advised to look for entry points into the market in accordance with the direction indicated by the Heiken Ashi candle.

A candle with a long body and both shadows. This may be a signal of the beginning of a correction. In this case, it is recommended to close some of the positions opened in the direction of the trend, or move the Stop Loss order.

A doji candle with a short body and long shadows. This is considered a sign of the end of the trend or its reversal. Traders are advised to close open positions and look for entry points in the opposite direction.

Experienced traders rate the signals received with the help of Heiken Ashi as less reliable, which implies the need for confirmation from other sources.

A simple strategy is that a signal is considered valid if it is confirmed on at least the next two candlesticks. For example, a position is opened on the third full-bodied candle of the same color as the signal one. However, it should be borne in mind that due to the delay of the Heiken Ashi, the trader may miss a significant part of the movement.

In combination with Heiken Ashi, various indicators such as Stochastic or MACD oscillators are often used. In this case, the oscillators serve as a source of signals, and the Heiken Ashi candles confirm them. You can also use non-indicator systems such as Price Action or traditional candlestick analysis.

Interesting approaches:

Using the Heiken Ashi multi-time frame indicator, which allows you to recognize long-term trends in the older periods of the chart.
The use of candlesticks based on the data of not two, but a larger number of adjacent bars, which increases the lag, but improves the filtering ability.
The calculation of the prices of Heiken Ashi candlesticks is not based on the real prices of periods, but on their values, smoothed using moving averages.

In general, the Heiken Ashi chart is a useful tool for analyzing the market situation and forecasting price movements. It helps to smooth out market noise, is easy to use and is suitable even for novice traders.

Heiken Ashi - Хейкин-Аши

RU: Индикатор Хейкен Аши: что это и как использовать

Heiken Ashi - Хейкин-АшиХейкин-Аши — это японский торговый индикатор и тип финансового графика, название которого переводится как “средний бар”.

Графики Хейкин-Аши схожи с графиками свечей, но отличаются более плавным и сглаженным внешним видом, поскольку они фиксируют диапазон ценовых движений, а не каждое отдельное ценовое колебание, как это делают традиционные свечи.

Индикатор был разработан в 1700-х годах Мунехисой Хоммой, который также является автором графиков свечей.

Эти графики активно используются трейдерами и инвесторами для анализа и прогнозирования ценовых движений.

Многие трейдеры в своей практике используют многофункциональные варианты ценовых графиков, такие как японские свечи и бары, которые предоставляют обширную информацию о движении котировок:

  • они создают наглядную картину рыночной ситуации на каждом временном интервале;
  • позволяют прогнозировать поведение цен в ближайшем будущем, основываясь на распознавании свечных моделей (что также применимо и к барам).

Точность анализа и прогнозов зависит от различных факторов, включая уровень рыночного шума. В торговых системах участники стремятся фильтровать этот шум с помощью дополнительных инструментов, таких как трендовые индикаторы. Румынский финансовый аналитик Дан Валку предложил новый способ отображения графиков котировок, который изначально способен устранять высокочастотные колебания на рынке.

Этот альтернативный метод называется Heiken Ashi и отличается своей методикой построения ценовых баров. Главная его особенность заключается в использовании цен не только текущего, но и предыдущего торгового периода.

Визуально свечи по этому индикатору практически идентичны традиционным японским:

  • они имеют тело, ограниченное вычисленными ценами открытия и закрытия (Open и Close);
  • могут быть восходящими (Open < Close), традиционно белого цвета, или нисходящими (Open > Close), красного цвета;
  • могут иметь верхние и нижние тени, когда максимумы и минимумы свечи выходят за пределы тела

Построение свечей Хейкен Аши

Свечи Хейкен Аши (HA) представляют собой метод визуализации ценового движения, который использует усредненные значения для сглаживания рыночного шума. Этот подход позволяет трейдерам лучше оценивать текущую рыночную ситуацию и выявлять тренды. Ниже представлены основные формулы, используемые для построения свечей Хейкен Аши:

Цена закрытия свечи на интервале с порядковым номером i равна взвешенной (Weighted Price):

Close_ha[i] = (Close[i] + Open[i] + High[i] + Low[i]) / 4.

Цена открытия определяется как средняя цена на предыдущей свече Heiken Ashi:

Open_ha[i] = (Open_ha[i-1] + Close_ha[i-1]) / 2.

  • Максимум представляет собой наибольшую из цен открытия и закрытия текущей свечи HA и максимума текущего периода свечного графика:

High_ha[i] = Max(Open_ha[i], Close_ha[i], High[i]).

  • Минимальная цена определяется аналогично, но использует наименьшее значение и минимум текущего периода свечного графика:

Low_ha[i] = Min(Open_ha[i], Close_ha[i], Low[i]).

В результате можно сделать следующие выводы:

  • Последовательность цен открытия (Open) в свечах Хейкен Аши эквивалентна средней за два периода с сдвигом на один бар. Это позволяет избежать применения интегральных формул, что в свою очередь снижает запаздывание индикатора по отношению к ценовому графику.

  • Тело свечи Хейкен Аши отражает разницу между реальной взвешенной ценой текущего периода и усредненной ценой предыдущего. Этот параметр можно интерпретировать как силу текущего ценового импульса.

  • Тени свечей формируются в тех случаях, когда реальные максимумы (High) или минимумы (Low) превышают рассчитанные значения.

Такой формат графиков позволяет быстро и эффективно оценивать рыночную ситуацию всего за один взгляд.

Как интерпретировать график Heiken Ashi

Анализ графика Хейкен Аши основывается на специфике формирования свечей. Вот ключевые моменты для понимания их поведения:

  1. Непрерывный ряд свечей в одном направлении свидетельствует о наличии устойчивого тренда.
  2. Уменьшение длины тел свечей может указывать на снижение интереса участников рынка к текущему движению, ослабление ценового импульса и увеличение вероятности коррекции.
  3. Свечи, не имеющие теней, направленных против основного тела, демонстрируют сильную и четко выраженную тенденцию.
  4. Тень свечи, направленная в противоположную сторону от тела, свидетельствует о растущем интересе трейдеров к открытию позиций против текущего тренда.
  5. Короткие свечи (так называемые доджи), обладающие длинными тенями в обе стороны, указывают на высокую вероятность изменения направления движения или перехода в боковое движение (флэт).

Как использовать индикатор Хейкен Аши

Индикатор Хейкен Аши включается в состав торговых систем как эффективный инструмент для анализа трендов. Однако его использование имеет свои особенности.

В частности, для MT4, который широко используется многими форекс-трейдерами, и для MT5, набирающего популярность в биржевой торговле, трейдерам приходится прибегать к сторонним индикаторам. Создатель платформы, компания MetaQuotes, пока не считает нужным добавлять Хейкен Аши как отдельный тип графика или включать его в комплект стандартных инструментов анализа.

В данном терминале свечи Хейкен Аши строятся поверх одного из стандартных ценовых графиков. Это не совсем удобно, так как наложение свечей (если выбраны японские свечи в качестве рабочего варианта) усложняет восприятие информации.

Для улучшения качества отображения можно воспользоваться несколькими способами:

  1. В настройках цветовой схемы задать цвет графика цен так же, как и фон. В этом случае трейдер получит чистый график Хейкен Аши в окне котировок. Однако большинство стандартных индикаторов из пакета поставки не смогут работать с ним. Вместо этого придется скачать и подключить (или написать самостоятельно) расширенные сторонние версии, которые могут работать с ценами этого графика.

  2. Построить баровый ценовой график. Он практически не влияет на отображение свечей Хейкен Аши и показывает характерные цены периодов (Open, Close, High, Low).

  3. Построить ценовой график в виде линии (она проводится по ценам закрытия периодов). Это удобно для тех, кто строит свои торговые системы с привязкой к окончанию предыдущего бара и началу текущего.

  4. Разместить график Хейкен Аши в нижней части ценового графика. В этом случае трейдер получает доступ ко всей информации стандартного графика и результатам его обработки данным индикатором. Такие версии Хейкен Аши также можно найти у сторонних разработчиков.

Ситуация с индикатором для QUIK, ставшего стандартом среди российских трейдеров и инвесторов, еще более сложная. Создатель платформы также не реагирует на просьбы пользователей включить Хейкен Аши в набор стандартных представлений ценового графика. Встроенные средства разработки не позволяют формировать свечные графические объекты на чарте. Поэтому сторонние индикаторы на Lua (язык программирования для QUIK) часто имеют довольно странные формы, с которыми неудобно работать. Ситуацию могут поправить индикаторы с алертами, сигнализирующие о значительных изменениях в поведении графика Хейкен Аши. Однако такой анализ с использованием машинных методов сложен и, соответственно, трудно реализуем.

Торговые сигналы и рекомендации по работе с Хейкен Аши

Индикатор Хейкен Аши часто рассматривается как инструмент для определения тренда, однако опытные трейдеры также используют его для получения торговых сигналов:

  1. Первая полнотелая свеча (растущая или падающая) с единственной тенью в направлении движения. Это может сигнализировать о начале трендового движения, как восходящего, так и нисходящего. После появления такой свечи трейдерам рекомендуется искать точки входа в рынок в соответствии с направлением, указанным свечой Хейкен Аши.

  2. Свеча с длинным телом и обеими тенями. Это может быть сигналом о начале коррекции. В данном случае рекомендуется закрыть часть позиций, открытых в направлении тренда, или переместить ордер Stop Loss.

  3. Свеча доджи с коротким телом и длинными тенями. Это считается признаком окончания тренда или его разворота. Трейдерам рекомендуется закрывать открытые позиции и искать точки входа в противоположном направлении.

Сигналы, полученные с помощью Хейкен Аши, опытные трейдеры оценивают как менее надежные, что подразумевает необходимость подтверждения из других источников.

  • Простая стратегия заключается в том, что сигнал считается действительным, если он подтверждается как минимум на двух следующих свечах. Например, позиция открывается на третьей полнотелой свече того же цвета, что и сигнальная. Однако стоит учитывать, что из-за запаздывания Хейкен Аши трейдер может упустить значительную часть движения.

  • В сочетании с Хейкен Аши часто используются различные индикаторы, такие как осцилляторы Stochastic или MACD. В этом случае осцилляторы служат источником сигналов, а свечи Хейкен Аши подтверждают их. Также можно применять безиндикаторные системы, такие как Price Action или традиционный свечной анализ.

Интересные подходы:

  • Использование мультитаймфреймового индикатора Хейкен Аши, позволяющего распознавать долгосрочные тренды на старших периодах графика.
  • Применение свечей, основанных на данных не двух, а большего числа соседних баров, что увеличивает запаздывание, но улучшает фильтрующую способность.
  • Расчет цен свечей Хейкен Аши не по реальным ценам периодов, а по их значениям, сглаженным с помощью скользящих средних.

В целом, график Хейкен Аши представляет собой полезный инструмент для анализа рыночной ситуации и прогнозирования ценовых движений. Он помогает сгладить рыночный шум, прост в использовании и подходит даже для начинающих трейдеров.

pumpdump

What is Pump & Dump?

What is Pump & Dump?

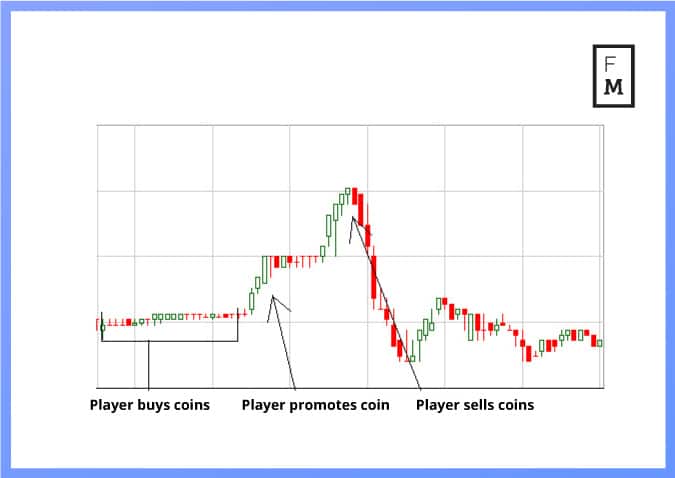
Pump and Dump is a manipulative scheme to increase the cryptocurrency exchange rate with a subsequent price collapse. Large owners of assets artificially increase (“pump up”, pump) their value in order to subsequently sell (“dump”, dump) it is as expensive as possible for small traders. As a result, the value of the asset decreases, and investors lose funds.

The pump & dump scheme originated in the securities market long before the advent of cryptocurrencies. The first documented episode of such fraud was the scam of the British trading company of the South Seas, which at the beginning of the XVIII century inflated the stock price with false promises of profit. This led to the emergence of the so-called South Sea bubble.

Subsequently, pump & dump was widely used in the American market of “junk” or “penny” stocks (cheap securities with low market capitalization) during the Great Depression in the late 20s – early 30s of the XX century. Then brokers sold cheap shares to each other, which led to an increase in demand and an increase in prices, after which the shares were thrown onto the public market. In the United States, such a practice has been declared illegal. The heyday of pump & dump schemes on the stock market occurred in the early 2000s.

Pump & dump has migrated to the cryptocurrency market in an almost unchanged form. This was facilitated by the lack of regulation. Currently, there are about two thousand “junk” cryptocurrencies. Messengers and social networks have a huge audience, so the pump & dump scheme is extremely popular in the crypto market.

Tens of thousands of pumps have been held during the existence of cryptocurrencies. According to experts from Imperial College London, at least two fraudulent schemes of this kind are implemented every day, and the monthly profit of the organizers is on average $ 7 million.

How does Pump & Dump work?

By choosing an exchange and a coin, the organizers buy tokens in small portions so as not to provoke a premature increase in the exchange rate. As a rule, these are little-known cryptocurrencies with low capitalization, popularly known as shitcoins. Sometimes relatively large cryptocurrencies are also used for pump & dump.

After buying the token, the pump begins – its “pumping”. Messengers, news feeds, social networks and exchange chats announce the rapid growth of the exchange rate and inform the name of the exchange platform, where the organizers of the scam place and take large orders for the purchase of a token through their bots, raising its quotation. This is the first wave of the pump.

Most major bitcoin exchanges restrict such activities, and the coins in their listing are rarely suitable for the implementation of the scheme. But there are popular platforms that support more than two hundred coins — they attract scammers in the first place.

False information about partnerships, investments or technological updates are used to warm up buyers. Paid “experts” are joining the disinformation campaign. The “sensational” information is distributed mainly through Telegram channels. At the same time, most of these channels directly report the pump, promising profit.

After that, investors are confident: since they know about the pump in advance, they will be able to earn. In fact, they are already victims, and some of them even pay for subscriptions to such pump channels.

In the case of a successful advertising campaign, the second wave of the pump begins — third-party investors come who independently influence the growth of the exchange rate. Against the background of the hype, the price is rising, the organizers sell tokens at an inflated cost, after which the cryptocurrency exchange rate returns to its original indicators.

What are the types of Pump & Dump?

Cryptocurrency pumps are divided into long-term and short-term.

  • A short-term pump lasts for several hours or even minutes and is used in the case of little-known cryptocurrencies with low capitalization. During the pump, their value soars rapidly, holds positions for a few seconds, after which it falls just as quickly. The financial costs of the organizers of such a pump are relatively low — the “pumping” of the course costs an average of 50 – 60 watts.
  • Cryptocurrencies from the top twenty are selected for a long-term pump. As a rule, it lasts for several days, and the ups and downs of the course occur in several stages. Organizing a pump of large cryptocurrencies requires significant financial costs, so large players or communities of traders are engaged in this.

What are the distinguishing features of Pump & Dump?

  • The revival of stock market activity (the appearance of large buy and sell orders) and the growth of the exchange rate in the absence of positive news;
  • The lack of similar price growth on other exchanges where cryptocurrency is traded;
  • An active cryptocurrency advertising campaign in stock exchange chats, forums, social networks and/or Telegram channels.

Is it possible to make money on the Pump & Dump scheme?

It is almost impossible to make money on a short-term pump: profit is possible only for the organizers, ordinary traders simply do not have time to react.

It is theoretically possible to make money on a long-term pump: a trader can count on profit, however, in this case he has only a few minutes to place an order. Moreover, the probability of losses is equal to the probability of profit.

Most pumps have one predictable feature: after the first collapse, a new short-term growth occurs due to the fact that retail investors are involved in trading. After a trader sells tokens at a loss during the collapse, he can buy them at a minimum and sell them during the second rise.

In no case can you buy coins during the second rise – this is a guaranteed loss. Secondary price peaks are typical only for fairly large coins with a capitalization of at least one million dollars.

Pump & Dump Examples

Parallel Coin

On the eve of November 5, 2019, the price of the ParallelCoin token increased several thousand times in a matter of hours (from $1.50 to more than $ 2,000), which gave users the opportunity to talk about the emergence of a “new bitcoin”. A few hours later, the price returned to the $2 level.

pump-and-dump
pump-and-dump

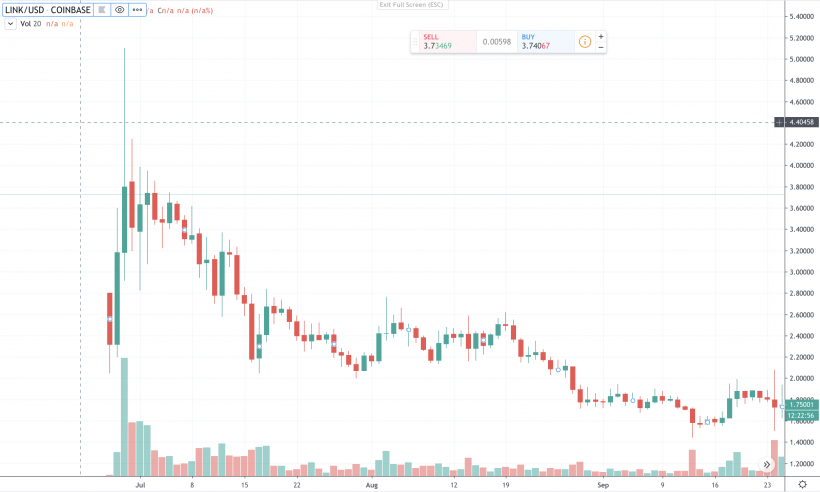
The increase in the price of the LINK token was preceded by messages on Twitter about cooperation: On June 13, 2019, Chainlink announced a partnership with Google Cloud, which confirmed this information. After that, the price of the LINK token increased from $1.19 to $1.93.

On June 26, Chainlink announced that it had included the token in the Coinbase listing, after which the price of the token rose to $ 2.24. On June 28, a pump began: several addresses bought large amounts of LINK on Binance, after which they transferred them through a number of fake addresses. By June 29, LINK’s price had risen to $4.45. According to observers, the daily trading volumes of ChainLink on the Binance exchange at the end of June were artificially inflated. Thus, with a capitalization of only $1.4 billion, this figure amounted to $863 million. The price movement chart for the mentioned period, according to some, looked unnatural, especially considering that volumes in favor of sales were recorded on one of the green candlesticks. There was a possibility that unknown people wanted to provoke FOMO, but could not achieve their goal.

On July 2, the dump phase began: addresses that had previously bought tokens began to dump them, after passing them through a chain of fake addresses. Only one of the addresses sold 4.2 million LINK tokens from July 2 to July 15. On the first day of the “dump”, on July 2, the value of the token dropped to $3.73.

On July 6, a recruitment message was posted on the project’s Twitter page, which, according to some observers, indicated a dump. Following this message, a graph was distributed on social networks, which displayed the estimated sales of 700,000 LINK tokens for each price rebound after reaching a peak at the end of June. After going through a small chain of addresses, these tokens were sold on Binance. Some believed that the announcement of the expansion of the staff was just an attempt to hide the large-scale liquidation of tokens.

By July 15, LINK was already worth $2.79, after which the collapse continued. As of September 16, LINK was worth $1.61: the price has almost returned to the level of mid-June.

E-Coin
E-Coin


On February 6, 2018, in a few hours, the price of the little-known E—Coin (ECN) token increased from $6 to $290 – by 4700%. The capitalization of the cryptocurrency has reached $ 1.5 billion. The token entered the top 20 on CoinMarketCap. After that, the price dropped six times during the day – to $45.

Then there was a new round of ECN growth to $228 (400%). The subsequent dump lowered the cost to $5. Then, during the day, the price increased again from $5 to $65 (1200%). At the time of these events, the project did not even have a working website.

pumpdump

Что такое Pump & Dump?

Что такое Pump & Dump?

Pump and Dump – манипулятивная схема повышения курса криптовалюты с последующим ценовым обвалом. Крупные владельцы активов искусственно повышают («накачивают», pump) их стоимость, чтобы впоследствии продать («сбросить», dump) максимально дорого мелким трейдерам. В результате стоимость актива снижается, а инвесторы теряют средства.

Схема pump & dump возникла на рынке ценных бумаг задолго до появления криптовалют. Первым задокументированным эпизодом такого мошенничества стала афера британской торговой Компании Южных морей, которая в начале XVIII века завысила курс акций неправдивыми обещаниями прибыли. Это привело к возникновению так называемого пузыря Южного моря.

Впоследствии pump & dump широко применялась на американском рынке «мусорных» или «копеечных» акций (дешевых ценных бумаг с низкой рыночной капитализацией) во времена Великой депрессии в конце 20-х – начале 30-х гг. XX века. Тогда брокеры продавали друг другу дешевые акции, что приводило к повышению спроса и росту цен, после чего акции выбрасывались на общедоступный рынок. В США подобную практику признали незаконной. Расцвет схем pump & dump на фондовом рынке пришелся на начало 2000-х.

В практически неизменном виде pump & dump перекочевала и на рынок криптовалют. Этому способствовало отсутствие регулирования. В настоящее время существует около двух тысяч «мусорных» криптовалют. Мессенджеры и социальные сети имеют огромную аудиторию, поэтому схема pump & dump крайне популярна на крипторынке.

За время существования криптовалют состоялись десятки тысяч пампов. По оценкам специалистов из Имперского колледжа Лондона, каждый день реализуются как минимум две мошеннические схемы такого рода, а ежемесячная прибыль организаторов составляет в среднем $7 млн.

Read More

Фундаментальный анализ

Фундаментальный анализ на форекс

Фундаментальный анализ на форекс

Фундаментальный анализ (ФА) — это метод анализа и прогнозирования поведения валютного рынка и других финансовых рынков с учётом фундаментальных факторов. Как правило, применяется для планирования долгосрочного вложения.

Выделяют четыре категории фундаментальных факторов:

  • политические: выборы главы государства или выборы в парламент, смена власти, формы правления, государственного устройства;
  • психологические: слухи и ожидания;
  • форс-мажор: стихийные бедствия, природные катаклизмы, техногенные катастрофы, военные действия и др.;
  • экономические: финансовые показатели и события из жизни конкретной компании, публикацию макроэкономической статистики (ВВП, инфляция, уровень безработицы,
  • процентные ставки), выступления глав центробанков и так далее.

Read More

forex options

RU: Что такое форекс опционы

Этим вопросом задаются многие начинающие трейдеры. Forex опционы – это договор, предусматривающий право, но не обязанность, совершить покупку или продажу финансового актива по заданной стоимости в определенный временной период.

Этот термин происходит от латинского слова «optio» – «выбор» или «желание». На биржевом рынке существует схожее понятие – фьючерс. Но в отличие от него опцион форекс не предусматривает обязанности купить или продать актив.

Впервые контракты на право покупки или продажи в будущем времени появились в 1636 году во время голландской тюльпаномании, они позволяли заключать сделки при отсутствии реальных средств для оплаты товара.

В ХХ веке активом начали торговать на американской бирже. В конце прошлого века его популярность выросла и этот тип контрактов стал котироваться на внебиржевых рынках.
Read More

Renko

RU: Что такое график Ренко

График Ренко – это инструмент со своими правилами

График Ренко в мт4 (mt5) предоставляет возможность видеть реальные флуктуации курса, без примесей рыночного шума. В этом заключается главное его достоинство.

Формула его построения проста – прямоугольник рисуется в системе координат только, когда изменение стоимости превышает установленное трейдером значение.

Прежде, чем строить график Ренко для Metatrader, стоит указать два важных момента:

  • ориентир по стоимости;
  • длину порога.

Программа построения принимает в расчет первый показатель, чтобы знать, какие цены будут использоваться, чтобы построить график Ренко в мт5 (mt4).

Зачастую используется цена закрытия для определенного рабочего отрезка (таймфрейма).

В некоторых ситуациях берутся наименьшие и наибольшие показатели стоимости.

Обычно при признаках увеличения стоимости основой для построения нового элемента служит максимальное значение цены. Если разница между ним и предыдущим положением тренда достигает указанного числа пунктов, рисуется пустой четырехугольник, свидетельствующий о подорожании.

Если цена идет на спад и минимальное значение достигает установленного числа пунктов от предыдущего уровня, рисуется закрашенный прямоугольник, свидетельствующий об удешевлении.

Длина порога – количество пунктов, выбранное трейдером, при прохождении которого в графическую систему добавиться квадрат. Наиболее рекомендованным считается значение в десять пунктов.

График Ренко, отзывы инвесторов о котором преимущественно положительные, является упрощенной комбинацией японских свечей. Если при свечной модели строятся четырехугольники разного размера, то одинаковые прямоугольники – отличительная черта, которой обладает график Ренко. Хвосты у блоков (тени) здесь так же отсутствуют (хотя их можно подключить), что позволяет отличить Renko от свечной модели.

Есть у Рэнко и минусы. Главный – отсутствие возможности наблюдать динамику изменения цены в периоды флэта – простоя на финансовой бирже. Пока тренд не пройдет установленное количество пунктов, индикатор не добавит новый элемент.

С другой стороны, он создавался, чтобы отсеивать лишние шумы в периоды низкой активности и винить его за такой недостаток вряд ли уместно.

Как анализировать график Ренко и как с ним работать?

Мы разобрались, что это – график Ренко. Теперь поговорим о том, как его правильно анализировать и применять.

Основная цель создания индикатора Renko – четкое определение движения тренда на рынке. С его помощью можно вычислить средние показатели сопротивления и поддержки, так как каждый квадрат отображает усредненное их значение.

Если долго не появляется новый квадрат, аналитик понимает, что сейчас на рынке период застоя. Цена не выходит за пределы указанных пунктов, а значит, применять популярные торговые стратегии не рекомендуется.

О выходе из флета может свидетельствовать появление нового четырехугольника. Если он будет аналогичной окраски с предыдущим, значит, тренд вышел из ценового коридора и продолжил движение в прежнем направлении. Если окраска отличается, это может свидетельствовать о развороте тренда.

Самая эффективная стратегия работы – торговать на разворотах. Необходимо поймать точку, когда тренд точно развернется, чтобы открыть сделку.

Используя Рэнко, советуем открывать позицию не раньше, чем в системе координат появится второй квадрат, аналогичной окраски, что и предыдущий.

На первом кирпичике открывать сделку неэффективно, поскольку его появление может свидетельствовать о ложном развороте тренда, особенно, если трейдер торгует на небольших таймфреймах или задал для прямоугольника мало пунктов.

Эксперты рекомендуют дождаться второго кирпича, чтобы убедиться в достоверности разворота.

Если тренд разворачивается по направлению вверх, открывают сделку на покупку. Если тренд разворачивается по направлению вниз – на продажу.

Тейк профит рекомендуется ставить чуть выше линии сопротивления или поддержки соответственно, поскольку, пробив ее, ценовой вектор может развернуться.

Чтобы работа была максимально эффективной, не следует выбирать таймфреймы больше Н1 и устанавливать ценовой коридор для добавления нового графического элемента больше десяти пунктов.

В целом график Ренко в тестере стратегий показывает аналогичные торговые результаты, что и фигура треугольник в Форексе, и стратегии работы здесь схожие.

Renko
Renko
Ценные бумаги

RU: Ценные бумаги: Начало инвестирования на бирже

Как начать инвестировать в фондовый рынок?

Для начала стоит разобраться, что такое ценные бумаги, какие они бывают и какой доход могут принести

Что такое ценная бумага

Главным образом, это право на исполнение имущественных обязательств — получение части прибыли компании, возврата занятых денег и прочее. Но не только. Также это может быть право на участие в делах компании — например, на собрании акционеров. Предъявив ценную бумагу, вы можете осуществить свои права (например, получить дивиденды , проголосовать на собрании) или передать их другому владельцу (например, продать или переуступить).

Чаще всего необязательно приносить физически бумагу, которая подтверждает права владельца, достаточно информации, засвидетельствованной в реестре владельцев бумаг.

Read More

Leverage (finance)

What is leverage in Forex

The enormous popularity of trading is gaining momentum around the world. A few years ago this concept did not have the same significance as it does now. Trading has been known among professional economists and marketers for a long time, but only now this field of activity is in great demand. It is worth noting the fact that the population of European countries earns a lot of money on the stock exchange. Successful activity depends on many factors, operating principles and methods that are used in this direction. The right path will require special knowledge and skills. Leverage allows you to carry out trading operations with large deposit amounts. In simple words, leverage is borrowing funds that can be used for their intended purpose to increase profits from deposits. The exchange provides players with enormous opportunities.

If a person does not have the required amount of funds on his own deposit to carry out financial transactions, he can borrow the required amount from a brokerage company. This allows you to open large positions. You can find out what leverage is from relevant literature, special training programs, online lessons and courses. Forex leverage is a beneficial tool for all parties involved in currency trading. Now this opportunity is perceived by participants as a great chance to start successful trading without having large personal funds. Experienced players know what leverage is and how to use it correctly. Proper use of virtual funds provided by brokers can bring decent income. Forex leverage allows participants to operate funds in order to increase your capital.

Leverage is an additional opportunity

Today, forex leverage is an interest-free loan provided by brokers for trading processes. The tool makes it possible to attract new players with small deposits to participate in transactions. You will be able to trade with small funds on par with decent institutions. Leverage means additional opportunities, new levels of earnings on Forex and participation in trading. Varieties of trading allow you to choose the best options for players. You can use financial leverage in certain cases:

  • aggressive trading style, which ensures rapid deposit acceleration;
  • when opening a large number of forex orders, a deposit will be required;
  • strategic investment, the selection of minimum loan indicators occurs.

Any trading with leverage can ensure successful trading if you use the opportunities provided wisely and correctly. The ideal option when choosing leverage is to calculate all the risks and determine the outcome you need. Inexperienced beginners try to keep up with the enormous opportunities, but forget about the possibility of financial “merging”. You need to clearly understand what leverage is in Forex and know all the features of this instrument.

  • Choose an exchange that offers maximum Forex leverage.
  • Explore different platforms, trade on demo accounts.
  • Try to place a bet where the amount is greater than your deposit.
  • Wait until all bets are closed and analyze the results.

Forex leverage has its own prospects and such an offer looks very attractive to trading participants. But don’t rush, carefully weigh each step and analyze the market situation. Only with full confidence in your abilities and the right strategic direction, begin to take advantage of all market opportunities.

Forex leverage, features and benefits

Lending is a very profitable exchange instrument and has a lot of advantages and disadvantages. Leverage in Forex allows you to increase your deposit and make quite profitable trades. Let’s highlight the main positive aspects:

  • insignificant losses when compared with income;
  • the ability to place bets, the price is higher than the account on deposit;
  • increasing the contribution by a couple of times with minimal waste of time.

Forex leverage also has another side – incorrect identification of pairs of monetary units can lead to loss of deposits in a short period of time. Therefore, competent players place bets whose amount will not exceed ten percent of the deposit. This will save you from unnecessary losses. Wikipedia gives a clear definition of what leverage is in Forex and helps determine further actions in the field of financial relations in the currency market. Always listen to the advice and recommendations of knowledgeable people who have spent many years trading and have made a fortune in speculative market activities.

  • limit your losses due to low levels;
  • set stops, they will significantly reduce your losses and protect your funds;
  • minimize losses and save deposits for subsequent entries, do not get rid of unprofitable positional directions by reducing rates;
  • Be careful when using high leverage in Forex;

Successful growth is closely related to learning the principles of trading and understanding how leverage differs from other trading tools. Learn to use forecasts correctly when choosing currency pairs and study all the analytics for these monetary units. The market will not tolerate incompetent deposit management and will react very painfully to the chaotic approaches of participants. Use leverage in Forex consciously and choose suitable pairs at a given time.

Conclusions

The main thing that is important to know when using forex leverage in operations is the fact that leverage can be different. Leverage sizes depend on specific instruments (Rumus, Metatrader and others) and their liquidity, and not on the wishes of brokerage companies. When working with assets, you need to keep in mind that conditions may vary. It is important for all participants to know how leverage works in Forex and discover new ways to make money. Let’s consider two options for interacting with brokerage companies.

  • Buy cheaper, sell more expensive. The participant analyzes the market, chooses a profitable strategic direction, gives collateral to the brokerage company and asks for leverage to carry out transactions.
  • More difficult than the first option, making money on quotes that are falling. Suitable for experienced players.

Trading operations can be carried out according to various strategic developments. Beginners do not need to take risks and take a large leverage; start with small amounts of money so as not to lose all your funds. There are strict rules, it is important to always adhere to them:

  • These are not your finances and in fact are for personal assets. The participant works with what he does not have (an artificial booster).
  • This is just a lever, not a means, but a tool for activity. It must be returned to the brokerage company at the end of transactions.
  • Do not use large amounts at once.
  • If the result is negative, your personal account will be depleted quite quickly.

What leverage is in Forex can be found out in detail on specialized websites. There is no need to avoid borrowing money; this is normal practice. You need to understand what leverage does in Forex in order to navigate this market activity. Calculate all situations and start increasing your capital. Learn new approaches, new techniques and develop in your chosen direction. Earn money and find other ways, methods and directions today. There is enough information to acquire skills, knowledge and abilities in the market field. Do not stop at the results achieved, always strive for new heights.

What is currency intervention

What is currency intervention

The rate of any currency traded on the Forex market is a variable value. It is influenced by various market and non-market factors. Today we will supplement this information and talk about what currency intervention is.

Currency intervention is one of the instruments of the national bank

The term intervention is most often used when we are talking about the intervention of one or a group of states in the affairs of another state. This practice is not welcomed by the international community and is prohibited. But this prohibition does not apply to foreign exchange intervention. On the contrary, almost all national banks widely use its capabilities in their monetary policy. What kind of instrument is this?

Foreign exchange intervention is a financial transaction carried out by a national bank or government agency charged with financial regulation. The purpose of such intervention is to influence exchange rate movements of the national currency.

For those who are not very well versed in the intricacies of economic formulations, let us explain what currency intervention is in simple words.

In fact, this is an ordinary financial transaction, as a result of which currency, which is an official means of payment in the country, is bought or sold. In Russia, such a currency is the ruble, in the United States – the dollar, in Japan – the yen, and so on.

The state entrusts the function of conducting such financial transactions to its central bank, and in some cases to the Ministry of Finance. These institutions are authorized to carry out currency regulation and influence the exchange rate of the state’s domestic currency.

To increase this exchange rate, a certain amount of national currency is purchased on the market for the currency of a foreign country. Since the volume of these purchases is significant, a shortage of currency withdrawn from the market arises, and its exchange rate rises. Selling your country’s currency, on the contrary, leads to the market becoming saturated with this currency, which means its exchange rate decreases.

For what problems does currency intervention have the maximum effect?

Currency intervention can influence exchange rate movements of the national currency. This fact is undeniable. But in this regard, a reasonable question arises: what problems can be solved using this tool?

The purpose of currency regulation carried out using foreign exchange intervention is the following:

  • Maintaining the exchange rate within a certain price corridor. This approach to currency regulation is typical for countries with a fixed exchange rate.
  • Elimination of negative trends that the exchange rate may have on the development of the state’s economy.
  • Preventing significant deviations of the currency exchange rate from its equilibrium value. That is, the desire to ensure that the demand for currency and its supply are balanced.
  • Replenishment of the country’s gold and foreign exchange reserves, which is achieved as a result of the sale of national currency and the purchase of foreign currency.
  • Maintaining a level of liquidity of the national currency at which the volatility of its exchange rate will be minimal.

Who conducts currency interventions?

Typically, foreign exchange interventions are carried out by large banks, which are instructed by a national bank or body with appropriate powers to carry out a financial transaction. Such banks are authorized financial institutions to conduct foreign exchange interventions. They can carry out interventions:

  • On the interbank foreign exchange market.
  • On the Forex stock market.
  • On the commodity market.
  • On the currency exchange.

If the foreign exchange market cannot provide sufficient liquidity, then in this case foreign exchange interventions are carried out in the form of foreign exchange auctions.

The financial regulator independently selects a platform for conducting currency interventions. The Bank of Russia, for example, for such operations usually uses the trading platform of the Moscow Exchange, which, after merging with the MICEX, became the largest Russian exchange holding company. At the same time, it is necessary to pay attention to the fact that recently the currency intervention of the Central Bank of the Russian Federation has been carried out in a targeted manner; large-scale interventions have not been observed. This happened after the ruble exchange rate became floating.

Types of foreign exchange intervention

Depending on the methods of practical application, currency interventions are usually divided into types. The main types of intervention are the following:

  • Verbal. This type of intervention is inherently fictitious, since no actual purchase/sale of currency occurs. The country’s authorities declare their intention to make a one-time cash payment to purchase a large amount of currency, but at the same time they are holding a pause and are not entering the market. Typically, the foreign exchange market is sensitive to such information. This is what the bet is on. It is assumed that the majority of market participants will believe in the possibility of carrying out such a financial transaction and will follow the signal received, supporting the necessary trend in the development of the exchange rate of this currency.
  • Real intervention. Currency intervention of this type does not imply any provocative actions or statements on the part of the country’s central bank or high-ranking government officials. The purchase/sale operation of the national currency is carried out in reality, as evidenced by the report, which indicates the specific amount of the intervention made.
    Real mutual intervention. This is a joint, synchronously implemented agreement between the central banks of several countries, which undertake to simultaneously carry out foreign exchange intervention in their national market.

As practice shows, the effect of mutual intervention can be achieved more significantly than in the case of unilateral currency intervention. An example of such effectiveness was demonstrated by the agreement signed in 1985 in New York. The implementation of this agreement led to a drop in the value of the dollar by almost 50%.

  • Typically, the benefit from mutual intervention is received by the country participating in the monetary union. The relationship between the countries included in such a union makes it possible to build a unified approach to ensuring stabilization of the exchange rate relative to third countries.
  • Sterile and non-sterile intervention. Any central bank has obligations to creditors and issues cash. The totality of these financial resources constitutes the monetary base.

If a bank decides to buy national currency and spend foreign currency on it, then its gold and foreign exchange reserves decrease, as does the monetary base. The sale of national currency, on the contrary, leads to an increase in the gold and foreign exchange reserves and an increase in the monetary base. Therefore, it is generally accepted that foreign exchange intervention affecting the monetary base is unsterilized.

If a bank, while carrying out foreign exchange intervention, simultaneously carries out a financial operation on the domestic market, the result of which is the unchanged monetary base, then this will be considered a sterilized intervention.

Attitude of specialists to foreign exchange intervention

specialists working in the foreign exchange market believe that if the exchange rate is floating, then foreign exchange interventions lose their effectiveness. This point of view has the following justification:

  • In modern market conditions, it is not possible to determine the equilibrium exchange rate, despite the presence of a large number of methods for determining it.
  • Foreign exchange market volatility may be short-lived. Therefore, its presence should not always lead to the intervention of the national regulator in the operation of the foreign exchange market.
  • In practice, currency intervention does not always lead to the desired result. In some cases, its use may cause increased volatility, which is undesirable for any central bank.